U.S. Dollar Index
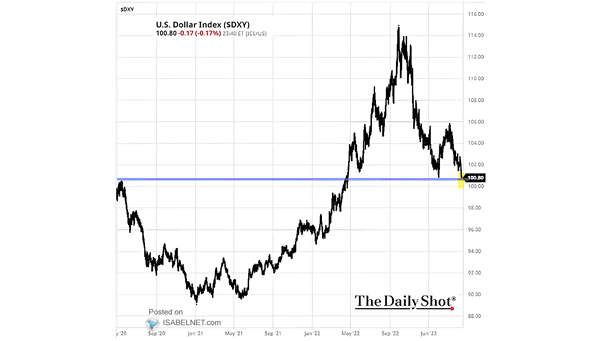
U.S. Dollar Index The U.S. dollar index slipping back below its 200-day moving average gives bears more reason to cheer, as the recent rebound loses momentum and the broader downtrend reasserts itself. Image: The Daily Shot
U.S. Dollar Index The U.S. dollar index slipping back below its 200-day moving average gives bears more reason to cheer, as the recent rebound loses momentum and the broader downtrend reasserts itself. Image: The Daily Shot
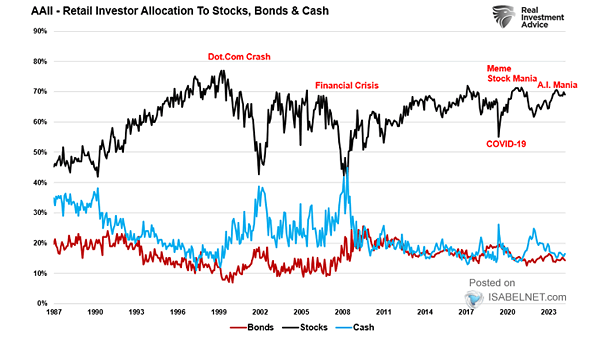
S&P 500 Forward Returns After Extreme AAII Bearish Sentiment Peaks Since 1990, when the AAII bearish sentiment exceeded 45%, as it did recently, the S&P 500 has delivered strong 12‑month gains, averaging more than 18%. Once again, the market looks ready to climb just when investors least expect it. Image: Real Investment Advice
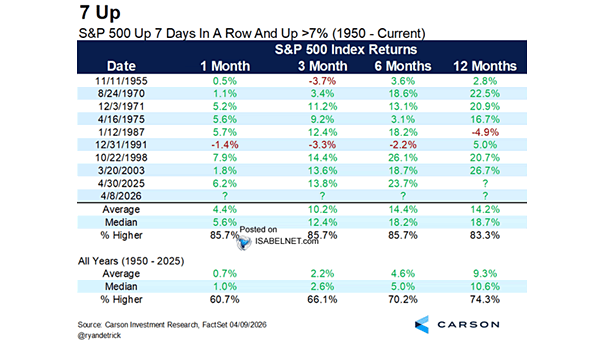
S&P 500 Up 7 Days in a Row and Up >7% After seven straight days of gains and a jump of more than 7%, history points to more good news ahead: median six‑month gains of 18.2% have followed similar streaks since 1950, putting a smile on bulls’ faces. Image: Carson Investment Research
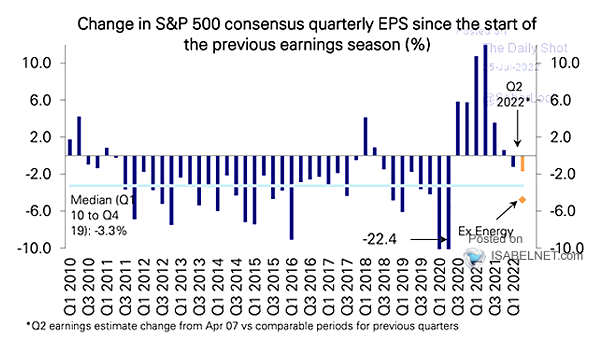
Evolution of S&P 500 Consensus Earnings Optimism is building on Wall Street. Analysts have lifted their S&P 500 bottom-up earnings forecasts for Q2 2026, betting on stronger corporate profit momentum through the year. It’s encouraging to see sentiment turning more positive. Image: Deutsche Bank Asset Allocation

Impact of U.S. Quarter-Over-Quarter Annualized GDP Growth The boost from the 2025 fiscal bill may be short-lived, as the conflict in the Middle East drives oil prices higher and curbs U.S. growth prospects. Image: Goldman Sachs Global Investment Research
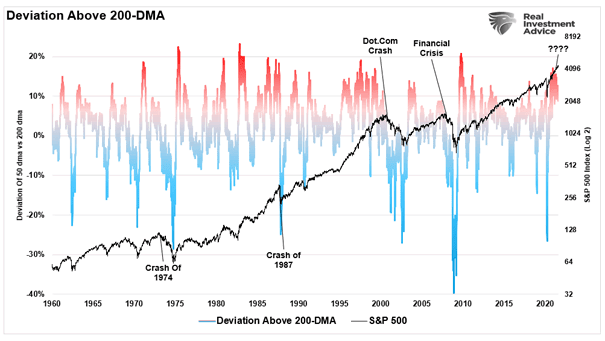
S&P 500 Average Return After Recapturing 200-Day Moving Average From Below History favors the bulls: when the S&P 500 has dropped below and regained its 200‑day moving average since 2000, it has averaged a 15% rally in the following 12 months. History doesn’t repeat itself, but it often rhymes. Image: Real Investment Advice
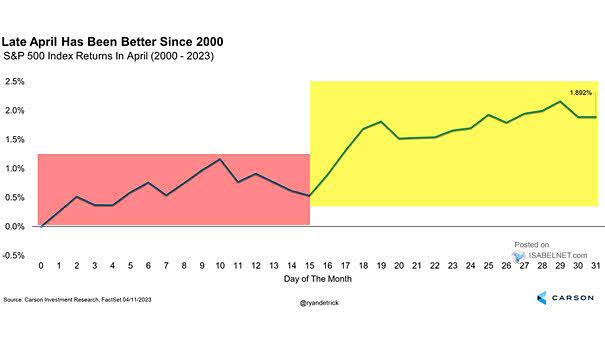
S&P 500 Index Returns In April Even with the Middle East conflict clouding the seasonal backdrop, April has historically been a strong month for U.S. equities, averaging positive returns since 1950. Image: Carson Investment Research
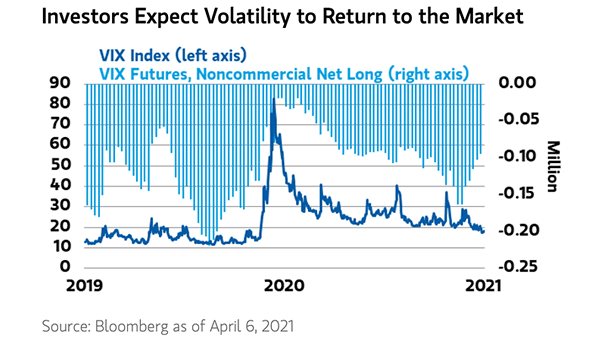
Volatility – VIX Index The VIX dropping below 20 signals fading market jitters and a steadier tone, typically a tailwind for equities as calmer volatility expectations often accompany rising stock prices. Lower volatility tends to invite buyers back in. Image: MarketDesk Research
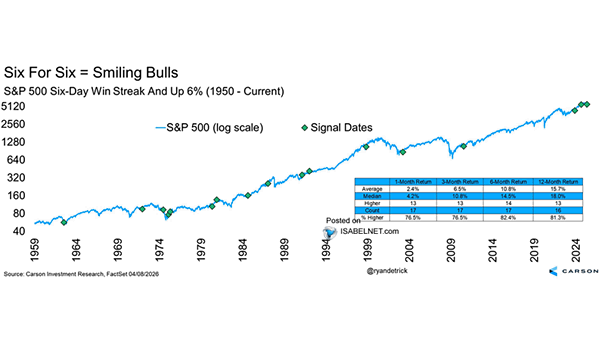
S&P 500 Performance After 6-Day Win Streaks and Up 6% Six days up in a row and a 6% surge: history says that combo often bodes well for U.S. stocks, with median 12-month gains of 18% since 1950, enough to keep the bulls smiling. Image: Carson Investment Research
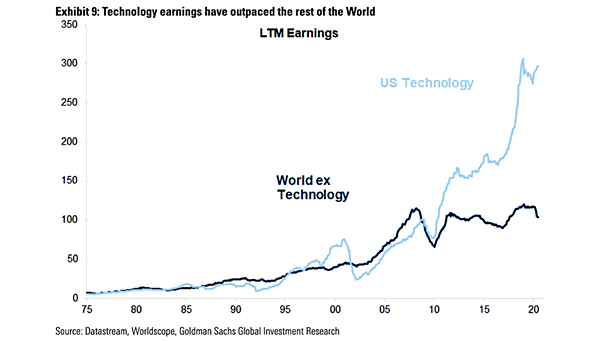
Valuations – Software vs. World ex. TMT and Technology vs. World TMT Valuations in global tech and software have narrowed sharply, with forward P/Es at their lowest level relative to world equities in more than five years. That could mark a buying window, assuming earnings momentum stays intact. Image: Goldman Sachs Global Investment Research
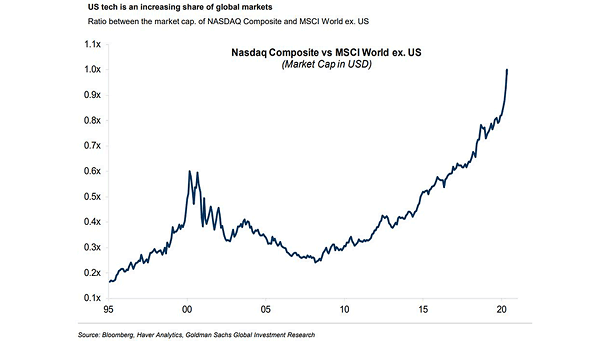
U.S. Tech – 3-Month Change in Price vs. 3-Month Change in FY2 EPS Until recently, U.S. tech earnings and stock returns have run hand in hand. With the correlation breaking down, dips are looking more like entry points, supported by solid growth prospects tied to AI adoption. Image: Goldman Sachs Global Investment Research