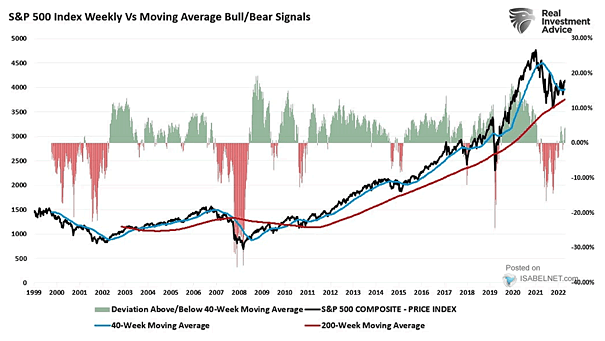
S&P 500 vs. Forward EPS

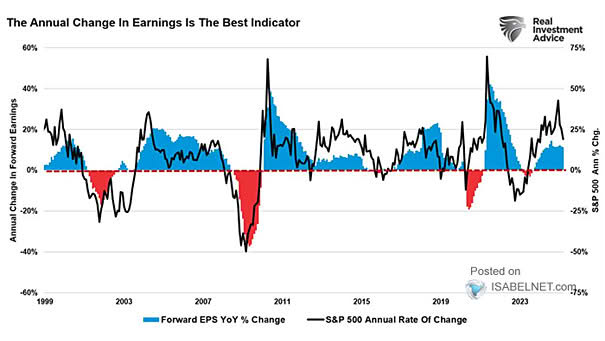
S&P 500 Annual Rate of Change vs. Annual Change in GAAP Earnings The S&P 500 tends to track corporate earnings, so strategies built on profit growth make sense for investors playing the long game. In the end, it’s earnings that lift stocks and sustainable growth beats short-term noise every time. Image: Real Investment Advice
Nasdaq-100 Win Streaks of 12 Days or More and Future Returns

Nasdaq-100 Win Streaks of 12 Days or More and Future Returns A 12-day winning streak has pushed the Nasdaq-100 into rare territory. History is on the bulls’ side with similar streaks leading to positive returns one year out every time since 1985, averaging 19.4%. Image: Carson Investment Research

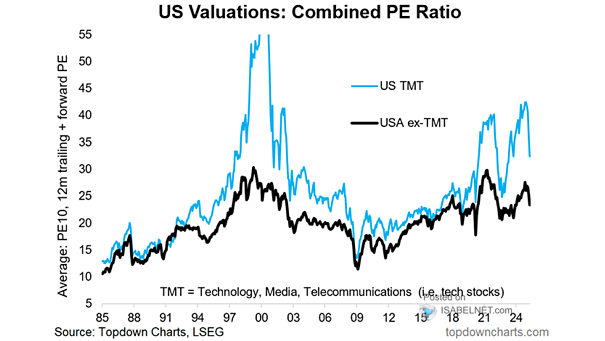
U.S. Stock Market Valuations – Combined P/E Ratio

U.S. Stock Market Valuations – Combined P/E Ratio U.S. tech stocks still command a premium over the broader market, fueled by strong growth prospects, though that gap looks unlikely to close unless a recession shakes investor confidence. Image: Topdown Charts

Rolling S&P 500 Change Over 11 Sessions

Rolling S&P 500 Change Over 11 Sessions It’s a rare burst of momentum: the S&P 500 has gained more than 10% in just 11 sessions, something that’s happened only 15 times this century. Moves like this remind us how unpredictable markets can be. Image: Deutsche Bank

S&P 500 Index – Best and Worst Days

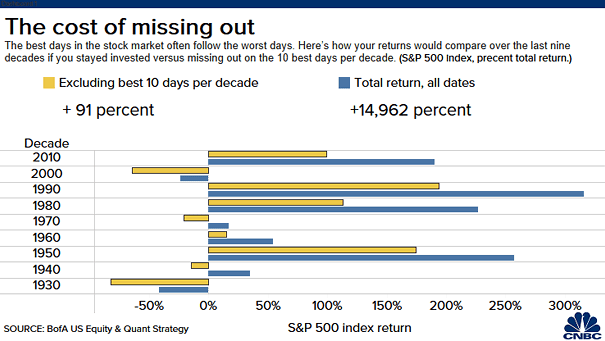
S&P 500 Index – Best and Worst Days For the S&P 500, the best and worst days often land right next to each other. Miss the best sessions and you leave returns on the table, but dodging the sharpest selloffs does more for long‑term performance. Image: Real Investment Advice
S&P 500 Performance After Back-To-Back 3% Weekly Gains

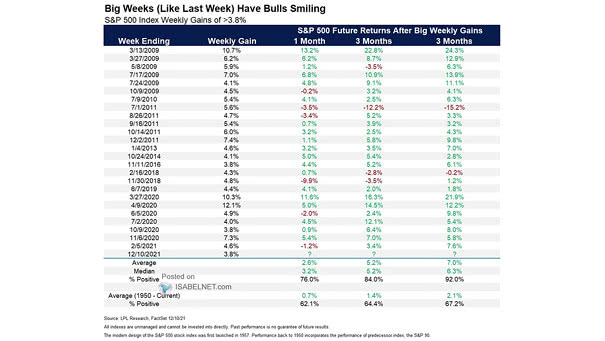
S&P 500 Performance After Back-To-Back 3% Weekly Gains Another sign the bottom may be behind us: the S&P 500 has just posted back‑to‑back weekly gains of more than 3%. Since 1950, stocks have been higher a year later in 13 of 15 similar cases, averaging a 14.1% return. Image: Carson Investment Research

Valuation – S&P 500 Forward P/E

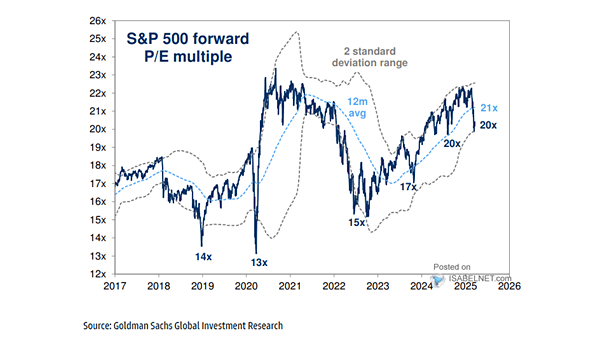
Valuation – S&P 500 Forward P/E Valuations have cooled sharply: the Mag 7 now trades at 25 times forward earnings, down from January’s lofty 31. Still pricey, sure. But in today’s market, it’s the best game in town, especially next to the other 493 stocks. Image: Goldman Sachs Global Investment Research

S&P 500 Index

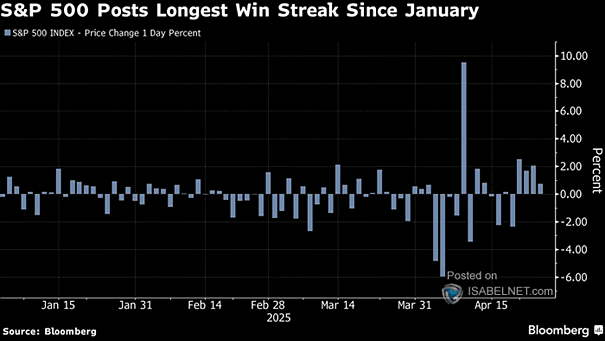
S&P 500 Index Yesterday, the S&P 500 rose 0.8% to close above 7,000, marking its first record since late January. The milestone underscores how tech stocks continue to power the broader rally. Image: Bloomberg

S&P 500 Median Forward Returns After 5+ Consecutive Weekly Declines

S&P 500 Median Forward Returns After 5+ Consecutive Weekly Declines Following five weeks of losses, the market’s rally fit the usual playbook. Dating back to 1965, periods like this have preceded a median 12.3% gain in the S&P 500 over the next 12 months. Image: Real Investment Advice
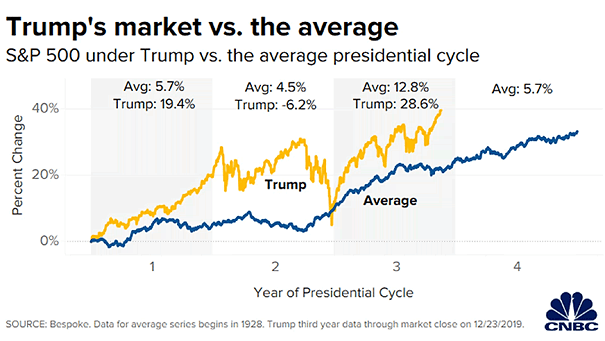
S&P 500 Four-Year Presidential Cycle

S&P 500 Four-Year Presidential Cycle Midterm election years tend to shake up U.S. markets, as policy risks and political noise rise before voters hit the polls. Uncertainty is the one asset every portfolio gets stuck with, and election season always adds more to the mix. Image: Carson Investment Research

Mega-Cap Growth & Tech (Market Cap and Earnings)

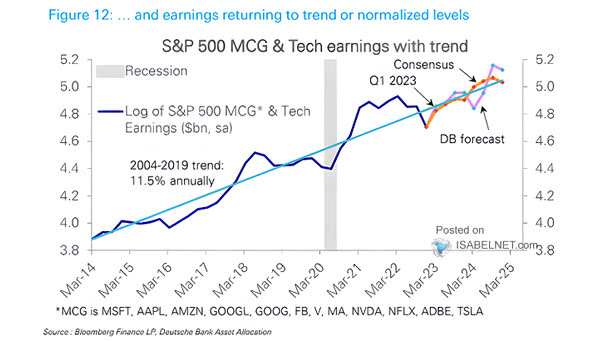
Mega-Cap Growth & Tech (Market Cap and Earnings) The tech pullback has left a bigger disconnect from earnings expectations. Once the mood shifts, risk appetite could roar back and drive stocks sharply higher. Fundamentals haven’t changed much, just the mood. Image: Deutsche Bank Asset Allocation