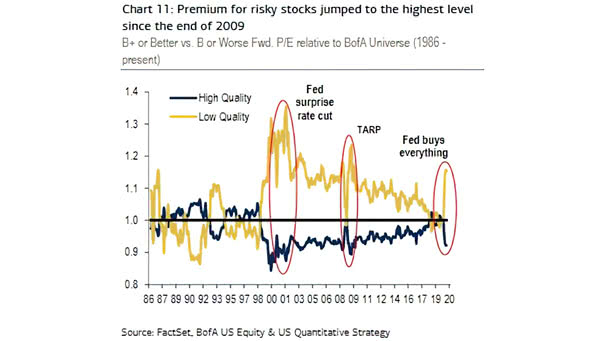
High Quality Stocks vs. Low Quality Stocks
High Quality Stocks vs. Low Quality Stocks Chart suggesting that higher quality stocks could be a good entry point today. Image: BofA US Equity & US Quantitative Strategy
High Quality Stocks vs. Low Quality Stocks Chart suggesting that higher quality stocks could be a good entry point today. Image: BofA US Equity & US Quantitative Strategy
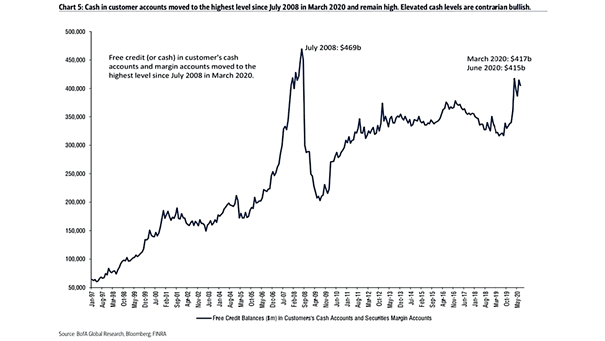
Cash in Customer Accounts More upside for stocks? As elevated cash levels are a contrarian bullish signal. Image: BofA Global Research
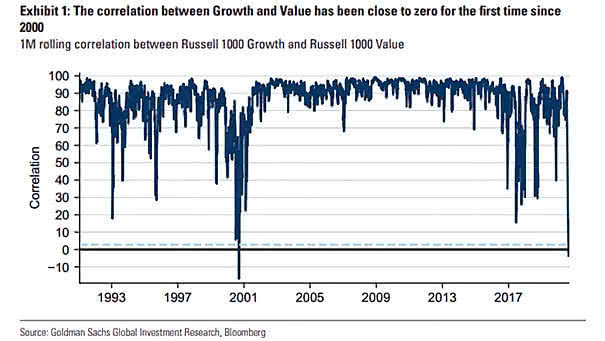
Correlation Between Russell 1000 Growth and Russell 1000 Value The correlation between Growth and Value has been close to zero, as during the dotcom bubble, when value investors were squeezed out while growth investors enjoyed high returns. Image: Goldman Sachs Global Investment Research
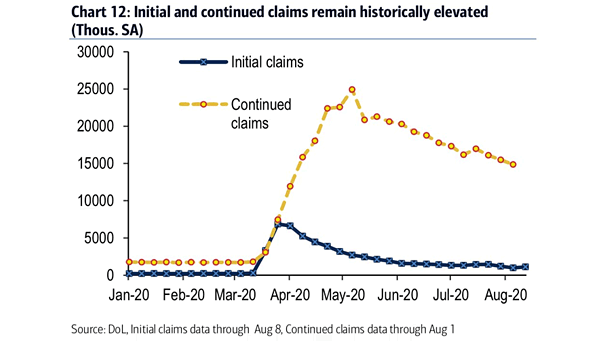
U.S. Labor Market – Initial and Continued Claims U.S. unemployment claims remain historically high, as recovery in U.S. labor market slows Image: BofA
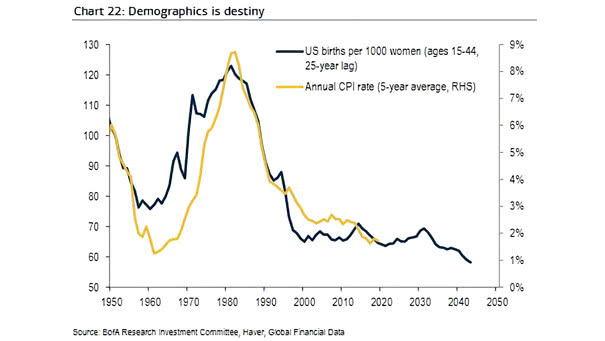
U.S. Demographics vs. U.S. Inflation Chart suggesting the correlation between demographics and inflation in the United States. Image: BofA Research Investment Committee
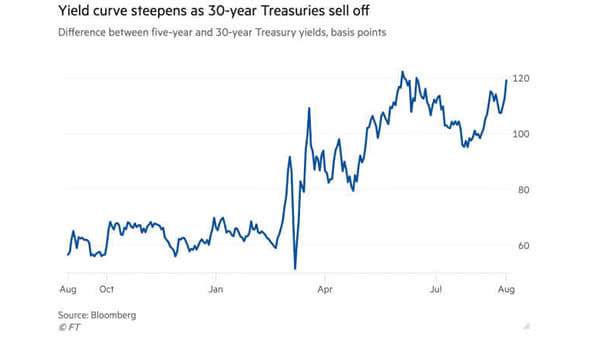
Yield Curve – Difference 5-Year and 30-Year Treasury Yields The yield curve steepens after the Fed pivot. Are Gold prices at risk? Image: Financial Times
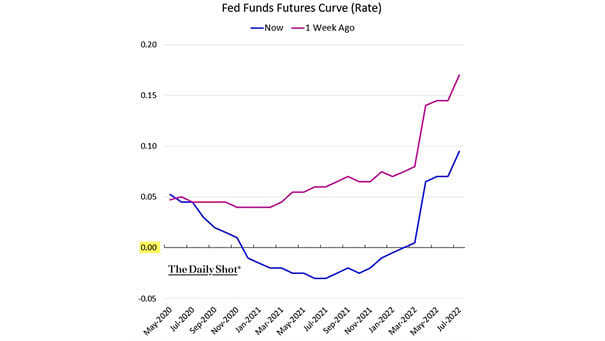
Fed Funds Futures Curve (Interest Rates) For the first time, traders are starting to price in negative U.S. interest rates for first time. Image: The Daily Shot
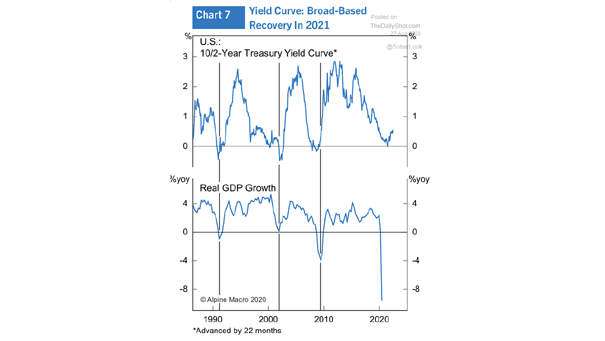
Yield Curve and U.S. Real GDP Growth – Broad-Based Recovery in 2021 The current steepening of the yield curve suggests a long road to recovery Image: Alpine Macro
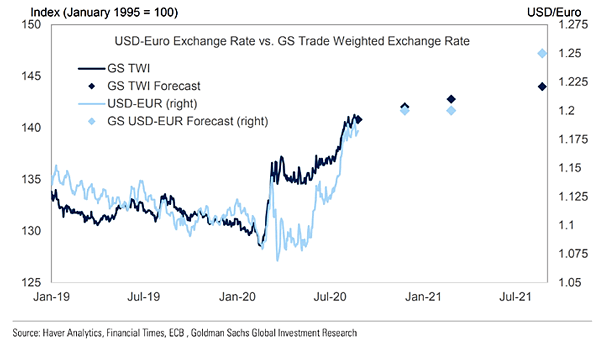
U.S. Dollar-Euro Exchange Rate Forecast According to Goldman Sachs, the U.S. dollar offers poor fundamentals and remains overvalued despite the recent selloff. Image: Goldman Sachs Global Investment Research
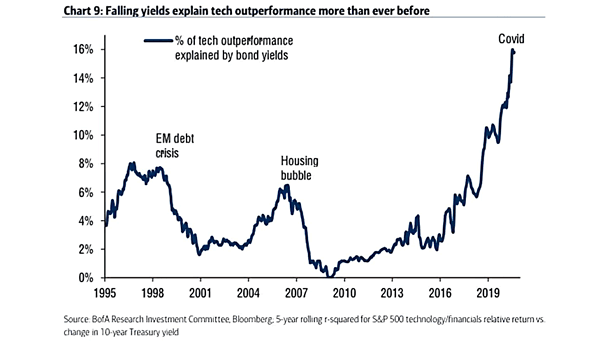
% of Tech Outperformance Explained by Bond Yields Chart suggesting that falling bond yields lead to tech outperformance more than ever. Image: BofA Research Investment Committee
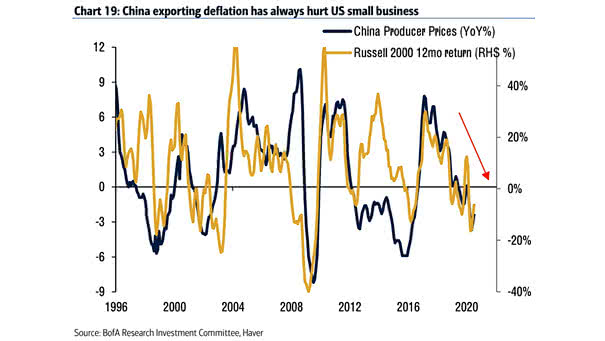
U.S. Small Cap Stocks – China Producer Prices vs. Russell 2000 12-Month Return Chart suggesting the impact of China producer prices on U.S. small cap stocks. Image: BofA Research Investment Committee