S&P 500 Index Bull Markets (Since WWII) the First Year
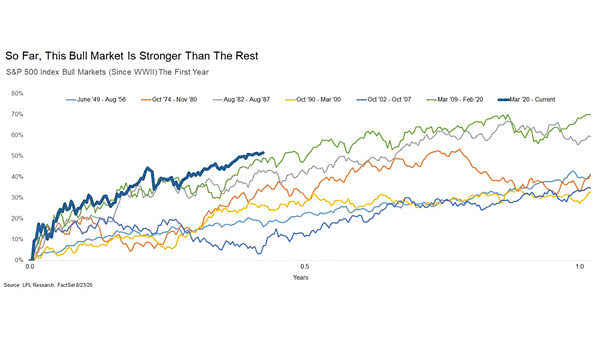
S&P 500 Index Bull Markets (Since WWII) the First Year So far, the new bull maket is topping all other bull markets since WWII. Image: LPL Research
S&P 500 Index Bull Markets (Since WWII) the First Year So far, the new bull maket is topping all other bull markets since WWII. Image: LPL Research
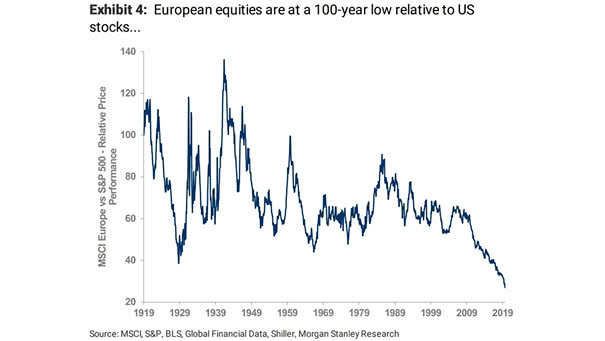
Performance – European Equities vs. U.S. Stocks Should investors look at U.S. stocks or European equities? Image: Morgan Stanley Research
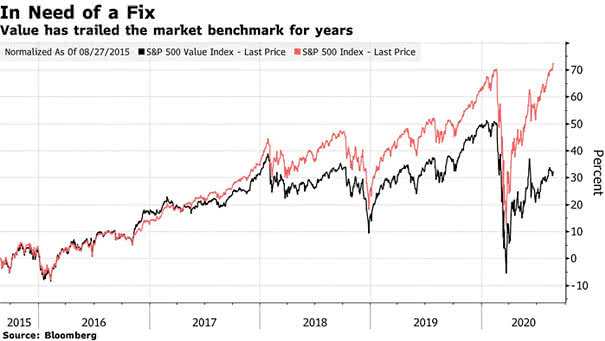
S&P 500 Value Index vs. S&P 500 Index As investors continue to pile into growth stocks, is value investing dead? Image: Bloomberg
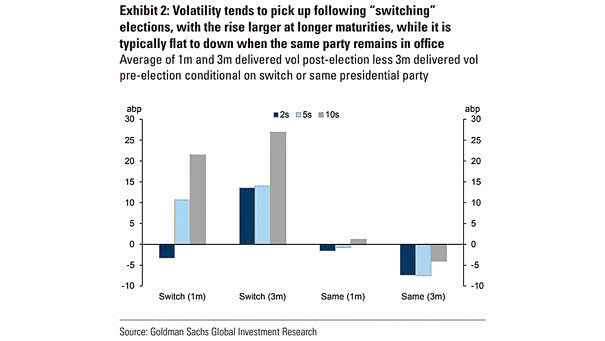
Volatility and U.S. Elections This chart shows how U.S. presidential elections affect volatility when the same party remains in office or not. Image: Goldman Sachs Global Investment Research
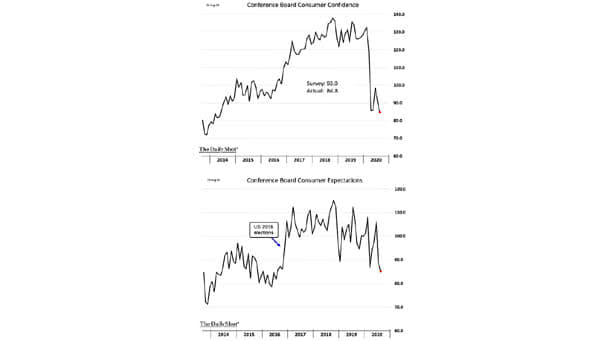
Conference Board Consumer Confidence U.S. consumer confidence falls in August, as more and more companies announce layoffs. Image: The Daily Shot
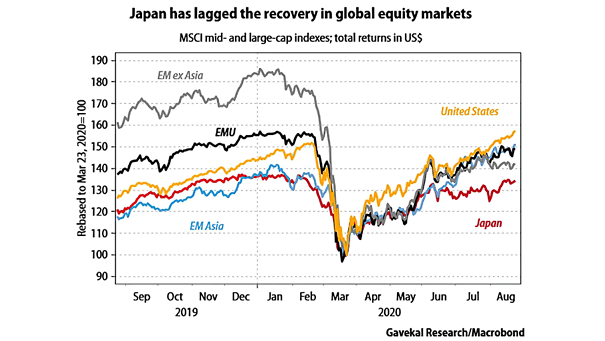
Japan and Global Equity Markets With a soft domestic economy, Japan’s equity market has lagged global equities. Image: Gavekal, Macrobond
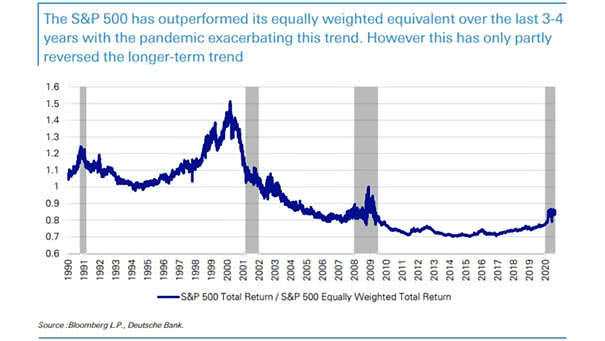
S&P 500 Total Return / S&P 500 Equally Weighted Total Return Will the S&P 500 continue to outperform its equally weighted equivalent? Image: Deutsche Bank
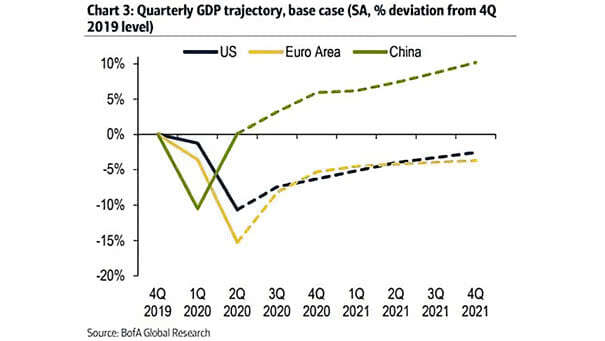
Quarterly GDP Trajectory, Base Case – U.S., Euro Area and China This chart suggests the base case scenario for 2020/2021 GDP growth. Image: BofA Global Research
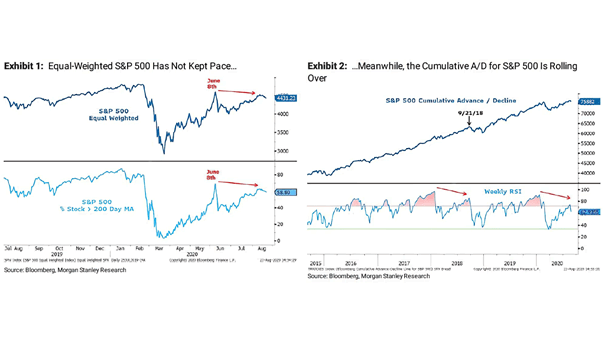
Equal-Weighted S&P 500 and S&P 500 Cumulative Advance/Decline Charts suggesting that a market correction may begin soon, as the S&P 500 cumulative advance/decline line fails to confirm the new all-time highs. Image: Morgan Stanley Research
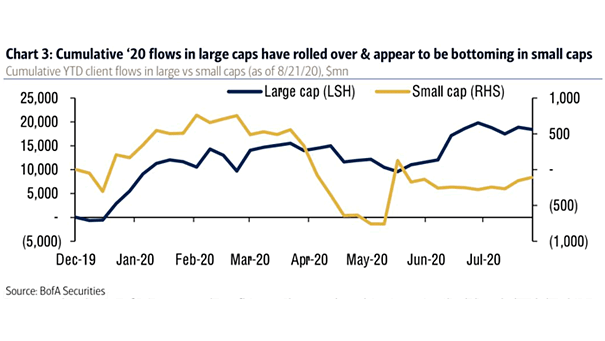
Cumulative YTD Flows in Large vs. Small Cap Stocks BofA’s clients sell large cap stocks and buy small caps, amid new market highs. Image: BofA Securities
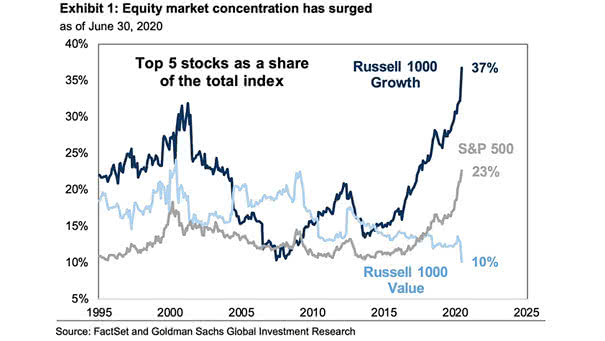
Market Capitalization – Top 5 Stocks as a Share of the Total Index The market capitalization of the five largest companies now accounts for 37% of the Russell 1000 Growth Index. Image: Goldman Sachs Global Investment Research