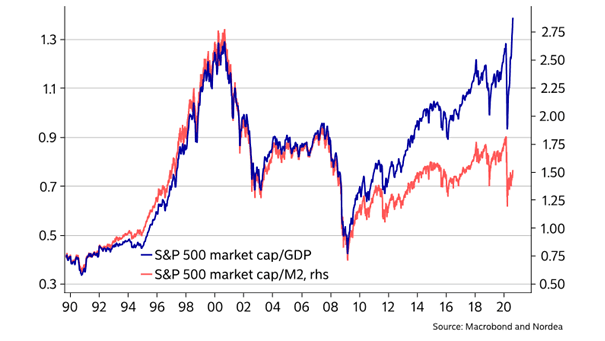
Debt as % of GDP by Global Sector
Debt as % of GDP by Global Sector Since the Global Financial Crisis, debt as % of GDP is much higher in the government and corporate sectors. Image: BofA Global Investment Strategy
U.S. Headline Retail Sales U.S. retail sales look V-shaped, but can it last? Image: Morgan Stanley Research
Seasonality – S&P 500 60-Day Rolling Forward Return On average, July 31 marks the start of the worst 60-day stretch for the S&P 500 since 1990. Image: Morgan Stanley Research
Monthly Foreign Net Purchases of Long-Term U.S. Securities Record foreign holdings of U.S. assets in 2025 point to lasting investor confidence, even in the face of global economic and geopolitical risks. Image: Bloomberg
U.S. Small Business Confidence and U.S. Employment Peak to Recovery Small business confidence is rebounding, but it could take many years for the U.S. labor market to recover. Image: BofA Global Investment Strategy
Flow – % Share of Rolling Three-Month ETF Inflows Investors reduced their equity exposure. Over the past 3 months, nearly 50% of all ETF inflows have funneled into HY, IG and Agg bonds. Image: Arbor Research & Trading LLC
Total Number of S&P 500 Guidance Instances The number of S&P 500 companies providing guidance declines over time. Image: BofA US Equity & US Quant Strategy
Flows into Tech Funds Potential bubble? Tech funds saw the largest 2-week inflow ever. Image: BofA Global Investment Strategy
Performance of U.S. Growth vs. Value Stocks, U.S. vs. non-U.S. Equities and S&P Cyclicals vs. Defensives Equity rotation are delivering for non-U.S. vs. U.S. markets and Cyclicals vs. Defensives, but not for Value vs. Growth. Image: J.P. Morgan
S&P 500 Index – Longest Bull Markets since WWII Chart showing every bull market since WWII. The recent bull market peaked at 400%. Image: LPL Research
S&P 500 Cash Return Payout Ratios (% of Net Income) S&P 500 payout ratio is in secular decline, as S&P 500 companies shift to buybacks. Image: Goldman Sachs Global Investment Research