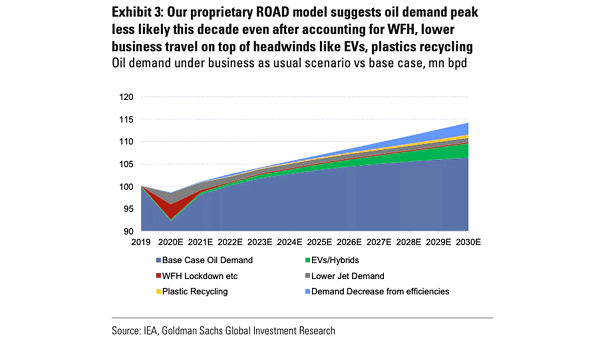
Performance – Retail Trading Favorites vs. S&P 500
Performance – Retail Trading Favorites vs. S&P 500 The most popular retail trading stocks have outperformed sharply the broader market. Image: Goldman Sachs Global Investment Research
Volatility and Number of 3-Sigma Moves This year has seen more extreme cross-asset moves than any year since 1998. Image: Morgan Stanley Research
Corporate Bond Defaults Corporate bond defaults are on the rise this year: US$70bn in Q2 2020, the largest on record. Image: Institute of International Finance
S&P 500 and Average Number of Accounts Holding S&P 500 Stocks Are retail traders behind the market’s recent rally? Image: Deutsche Bank Asset Allocation
G10 Real GDP Forecast Morgan Stanley expects a much faster recovery than the Great Financial Crisis. Image: Morgan Stanley Research
FANG Stocks % Weight of S&P 500 and Fed Balance Sheet Chart suggesting the relationship between the Fed balance sheet and FANG stocks. Image: BofA US Equity and Quant Strategy
% of IPO with Negative Earnings Growth at any cost? This chart shows the rise of loss-making companies going public. Image: Topdown Charts
Cross-Asset Valuations on their 10-Year Range Equity risk premiums suggest that equities are still cheaper than average. Image: Morgan Stanley Research
S&P 500 Median Forward Returns Following 1-Day Return < -5% This chart shows S&P 500 median forward returns following a more than 5% down day. Image: Goldman Sachs Research Division
BofA Private Client Sentiment As the chart suggests, BofA private client sentiment is far from exuberant and remains bearish. Image: BofA Global Investment Strategy
Real S&P 500 Around Recession End Dates This chart suggests that the S&P 500 is currently running ahead of the historical average. Image: Stifel