S&P 500 and Chicago Fed National Financial Conditions Index
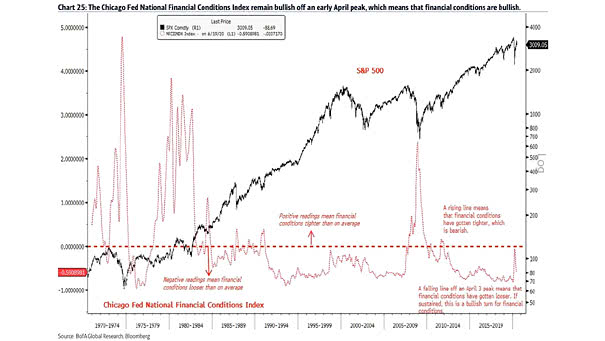
S&P 500 and Chicago Fed National Financial Conditions Index Fed financial conditions continue to improve, which is historically bullish for U.S. equities. Image: BofA Global Research
S&P 500 and Chicago Fed National Financial Conditions Index Fed financial conditions continue to improve, which is historically bullish for U.S. equities. Image: BofA Global Research
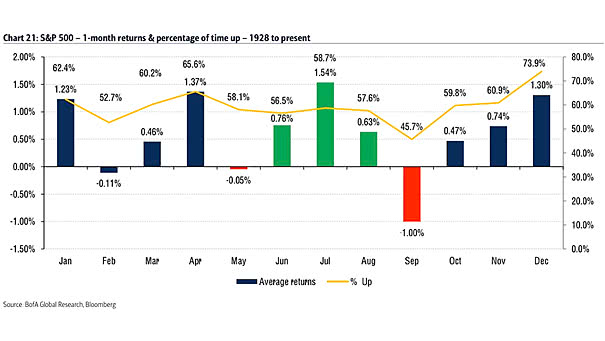
Seasonality – S&P 500 1-Month & Percentage of Time Up If you “sell in May and go away”, you could miss a summer rally, as June-August is historically the second best 3-month period. Image: BofA Global Research

Farrell Sentiment vs. S&P 500 The Farrell Sentiment is contrarian bullish, even after a 30%+ rally in the S&P 500. Image: BofA Global Research
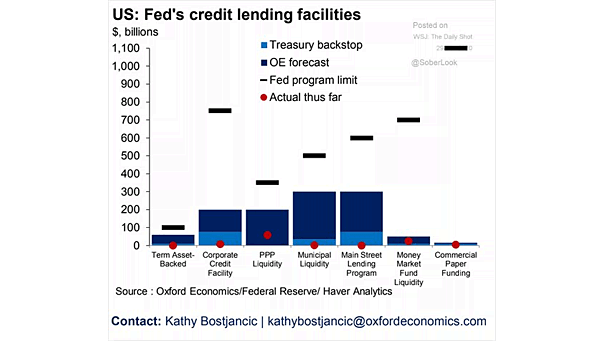
Fed’s Credit Lending Facilities Only a fraction of Fed’s emergency lending facilities has been deployed so far. Image: Oxford Economics
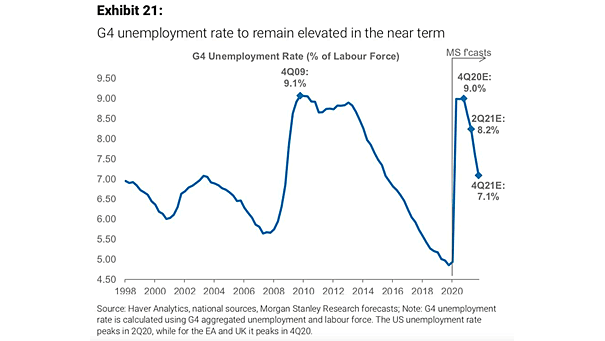
G4 Unemployment Rate The G4 unemployment rate is expected to peak at 9% in 2020:Q4. Image: Morgan Stanley Research
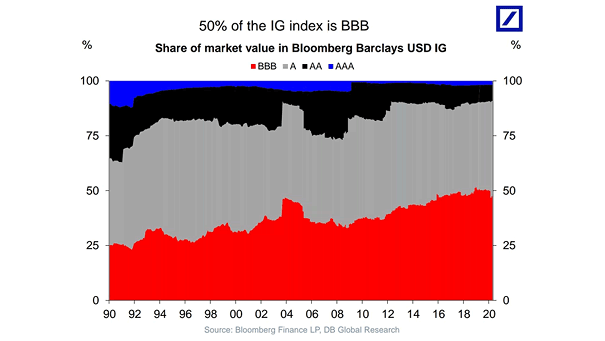
Corporate Bonds – Share of Market Value in Bloomberg Barclays USD IG (AAA, AA, A, BBB) Credit quality is deteriorating, as the amount of BBB-rated bonds, one step away from junk bonds, has doubled since 1990. Image: Deutsche Bank Global Research
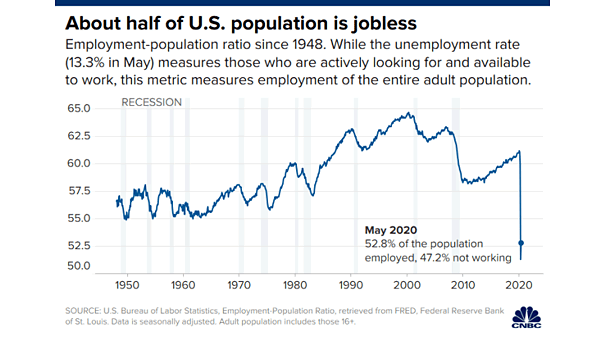
Employment/Population Ratio Since 1948 in the U.S. The challenge of unemployment in the United States: about half of the population is jobless. Image: CNBC
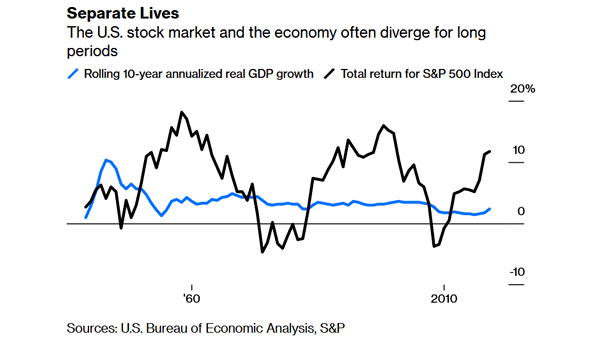
Rolling 10-Year Annualized Real GDP Growth vs. Total Return for S&P 500 Index Chart suggesting that the U.S. stock market can ignore the economy for long periods of time. Image: Bloomberg
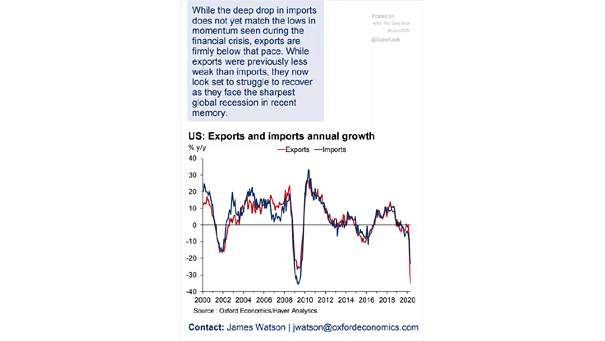
U.S. Economy – Exports and Imports Annual Growth In May, US exports sank to 11-year low, and imports dropped as demand for goods slows. Image: Oxford Economics
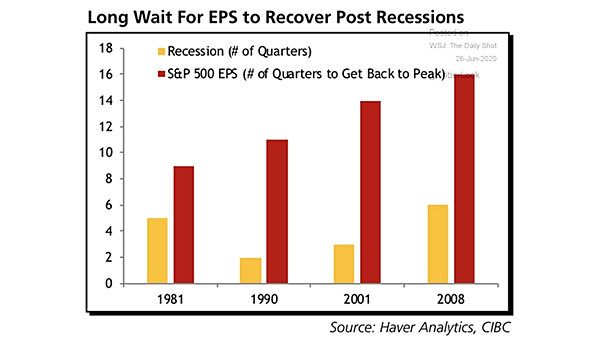
Earnings – EPS to Recover Post Recessions How long does it take for S&P 500 EPS to recover after a recession? Image: CIBC
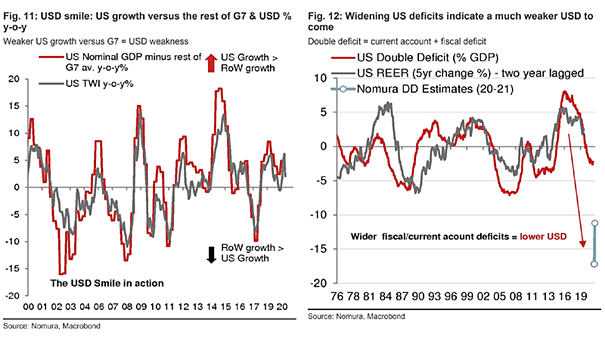
U.S. Dollar Smile (U.S. Growth vs the Rest of G7) and U.S. Double Deficit Global growth rebound and widening U.S. double deficit suggest a further depreciation of the U.S. dollar. Image: Nomura