U.S. Macro Fundamentals vs. S&P 500
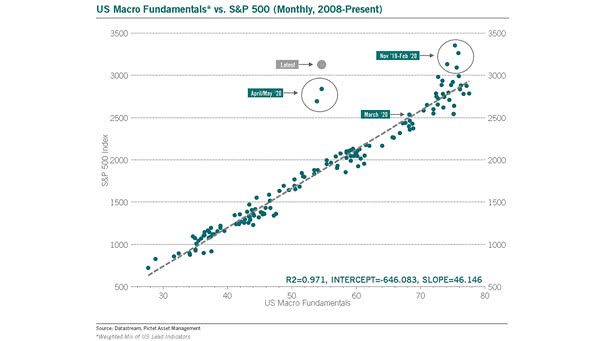
U.S. Macro Fundamentals vs. S&P 500 This chart shows the current wide divergence between U.S. lead indicators and the S&P 500 (R² = 0.97). Image: Pictet Asset Management
U.S. Macro Fundamentals vs. S&P 500 This chart shows the current wide divergence between U.S. lead indicators and the S&P 500 (R² = 0.97). Image: Pictet Asset Management
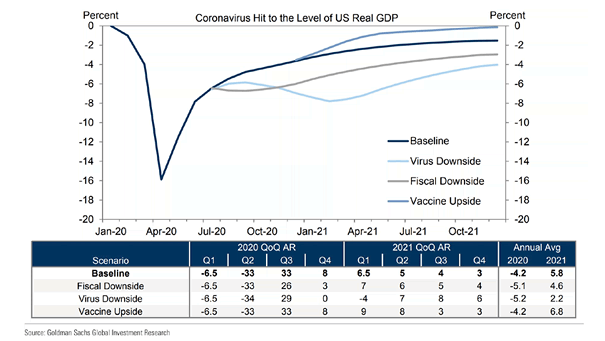
Coronavirus Hit to the Level of U.S. Real GDP Goldman Sachs now forecasts U.S. GDP growth of -4.2% in 2020 and +5.8% in 2021 (baseline scenario). Image: Goldman Sachs Global Investment Research
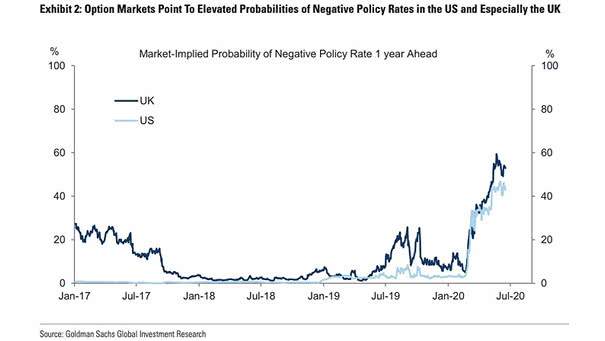
Interest Rates – Market-Implied Probability of Negative Policy Rate 1 Year Ahead Negative interest rates in the US and the UK ahead? Option markets point to elevated probabilities. Image: Goldman Sachs Global Investment Research
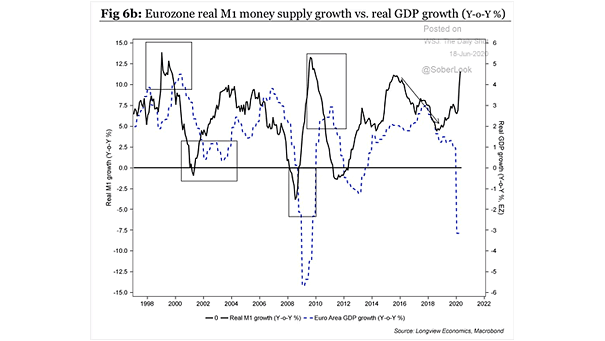
Eurozone Real M1 Money Supply Growth vs. Real GDP Growth This chart suggests the relationship between real M1 growth and euro area GDP growth. Image: Longview Economics
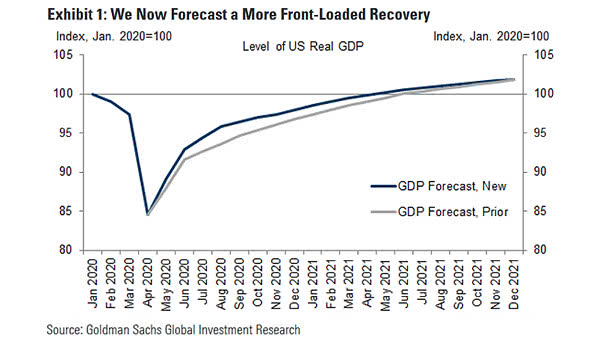
Level of U.S. Real GDP Forecast Goldman Sachs forecasts a more front-loaded recovery in the United States. Image: Goldman Sachs Global Investment Research
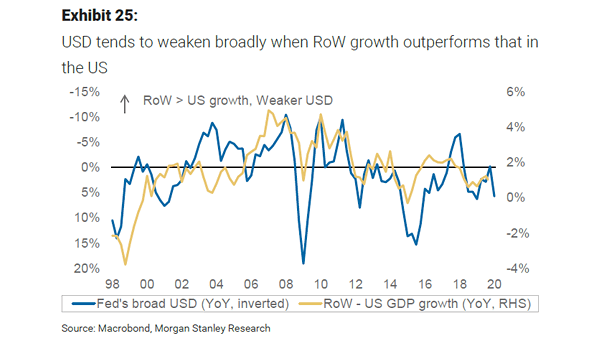
Fed’s Broad U.S. Dollar and Rest of the World Minus US GDP Growth This chart suggests that the U.S. dollar tends to weaken when RoW growth outperforms that in the United States. Image: Morgan Stanley Research
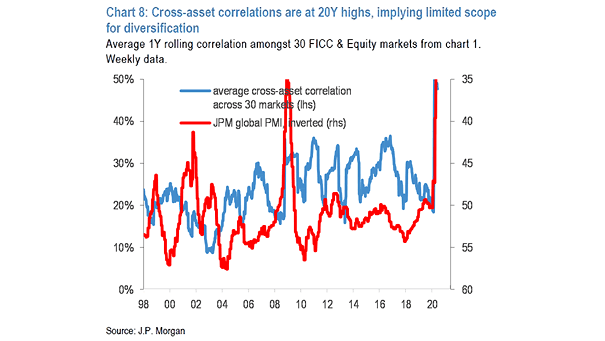
Cross-Asset Correlation and Global PMI Cross-asset correlations imply there is limited scope for diversification. Image: J.P. Morgan
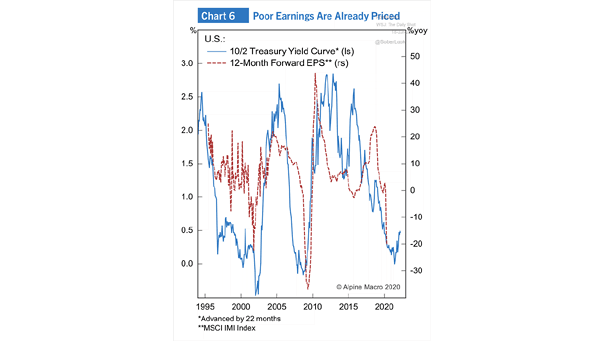
10/2 Treasury Yield Curve vs. 12-Month Forward EPS (Leading Indicator) Chart suggesting that the 10/2 Treasury yield curve tends to lead 12-month forward EPS by 22 months. Image: Alpine Macro
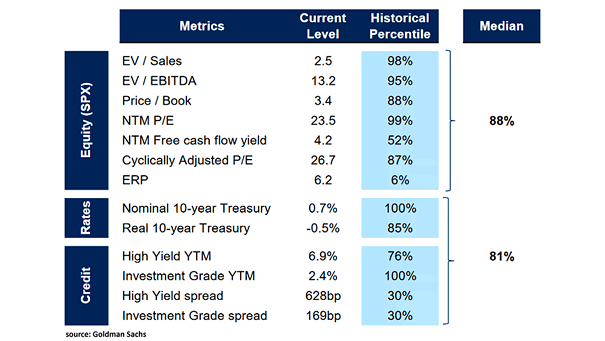
Valuation Metrics Across Assets This table suggests that median valuation metrics remain elevated by historical standards. Image: Goldman Sachs Global Investment Research
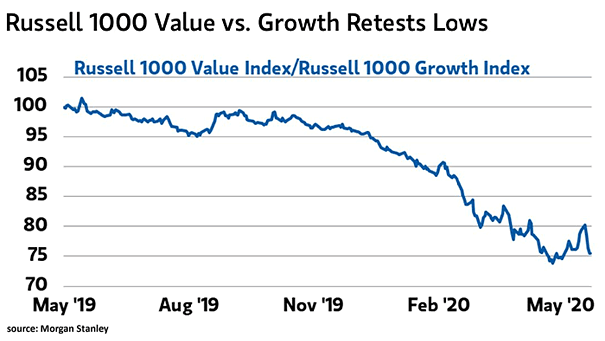
Russell 1000 Value Index vs. Russell 1000 Growth Index Russell 1000 value vs. growth retests lows, but value stocks should outperform growth stocks in the recovery phase. Image: Morgan Stanley
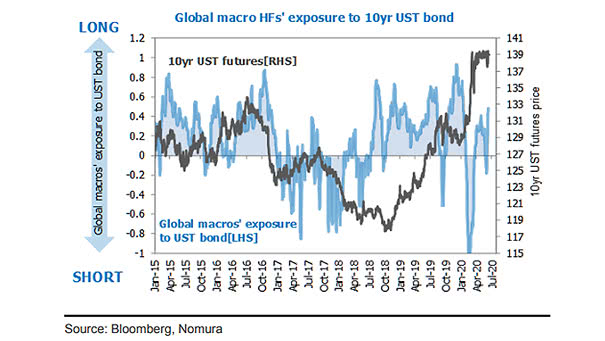
Global Macro Hedge Funds’ Exposure and U.S. 10-Year Treasury Bond Global macro hedge funds are long U.S. bonds. Image: Nomura