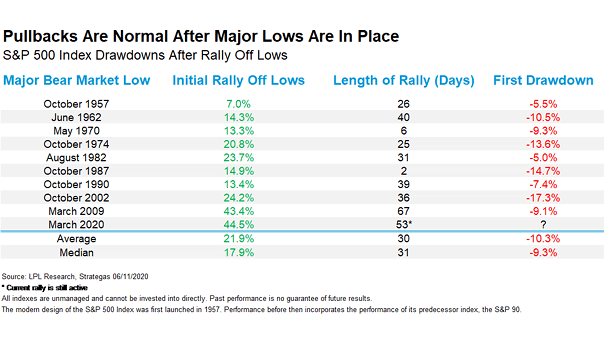
S&P 500 Index Drawdowns After Rally Off Lows
S&P 500 Index Drawdowns After Rally Off Lows After major bear market lows in place, pullbacks are actually perfectly normal. Image: LPL Research
S&P 500 Index Drawdowns After Rally Off Lows After major bear market lows in place, pullbacks are actually perfectly normal. Image: LPL Research

Share of Countries in Recession The global economy plunges into the worst recession since World War II. Image: The Wall Street Journal
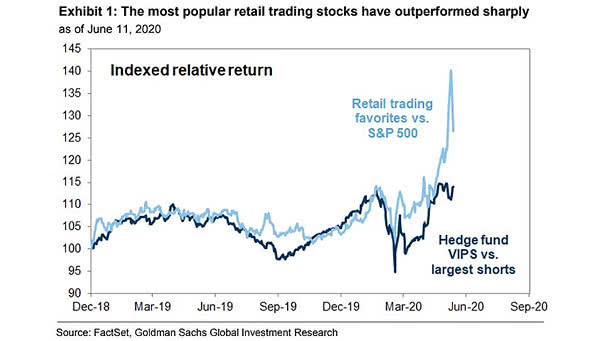
Performance – Retail Trading Favorites vs. S&P 500 The most popular retail trading stocks have outperformed sharply the broader market. Image: Goldman Sachs Global Investment Research
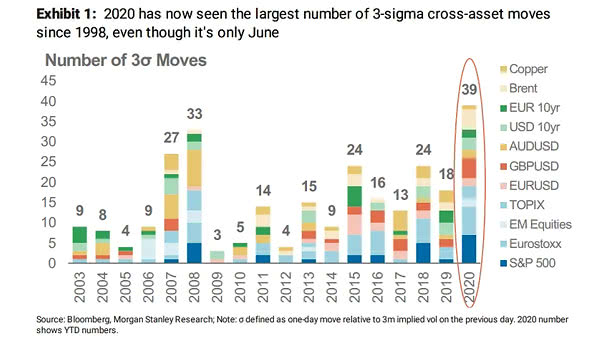
Volatility and Number of 3-Sigma Moves This year has seen more extreme cross-asset moves than any year since 1998. Image: Morgan Stanley Research
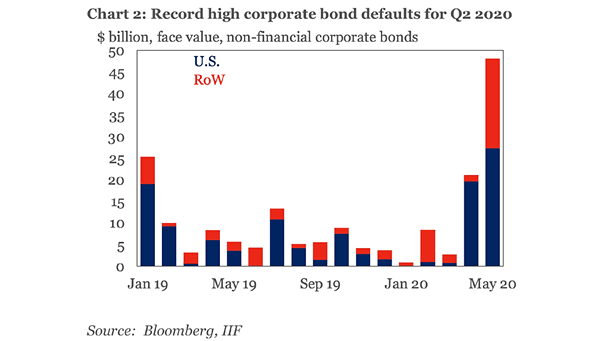
Corporate Bond Defaults Corporate bond defaults are on the rise this year: US$70bn in Q2 2020, the largest on record. Image: Institute of International Finance
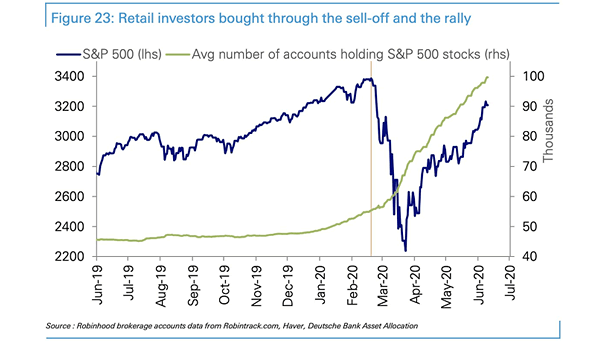
S&P 500 and Average Number of Accounts Holding S&P 500 Stocks Are retail traders behind the market’s recent rally? Image: Deutsche Bank Asset Allocation
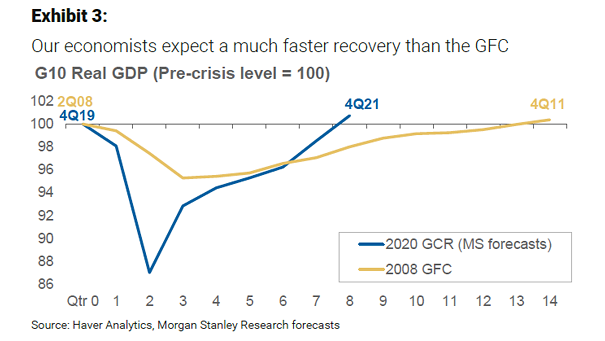
G10 Real GDP Forecast Morgan Stanley expects a much faster recovery than the Great Financial Crisis. Image: Morgan Stanley Research
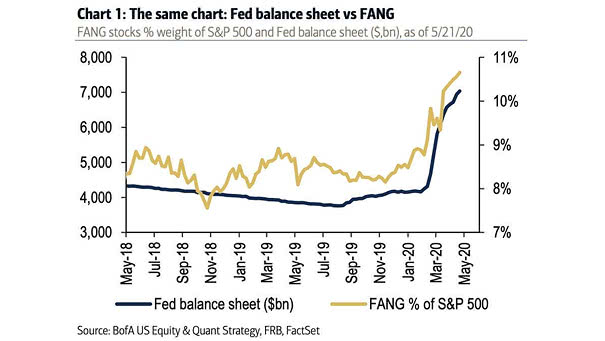
FANG Stocks % Weight of S&P 500 and Fed Balance Sheet Chart suggesting the relationship between the Fed balance sheet and FANG stocks. Image: BofA US Equity and Quant Strategy
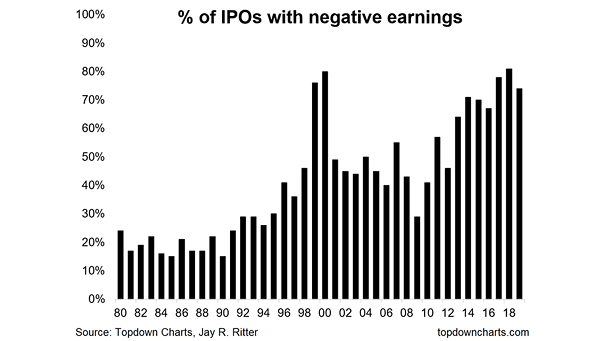
% of IPO with Negative Earnings Growth at any cost? This chart shows the rise of loss-making companies going public. Image: Topdown Charts
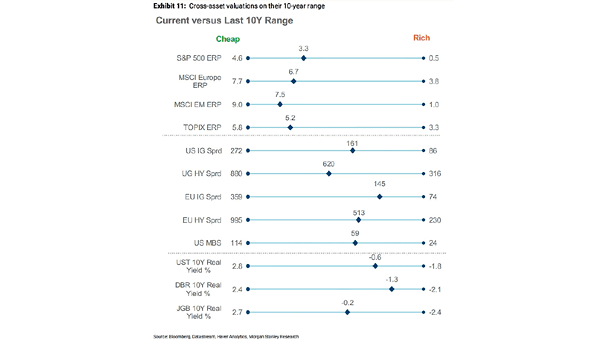
Cross-Asset Valuations on their 10-Year Range Equity risk premiums suggest that equities are still cheaper than average. Image: Morgan Stanley Research
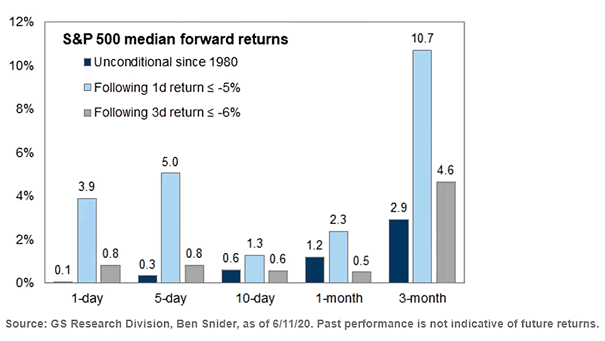
S&P 500 Median Forward Returns Following 1-Day Return < -5% This chart shows S&P 500 median forward returns following a more than 5% down day. Image: Goldman Sachs Research Division