Bitcoin: Currency or Asset Class? (Price and Volatility)
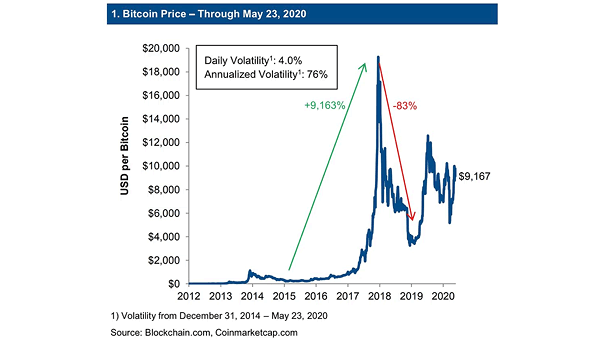
Bitcoin: Currency or Asset Class? (Price and Volatility) This chart puts into perspective the daily and annualized volatility of Bitcoin. Image: Goldman Sachs Global Investment Research
Bitcoin: Currency or Asset Class? (Price and Volatility) This chart puts into perspective the daily and annualized volatility of Bitcoin. Image: Goldman Sachs Global Investment Research
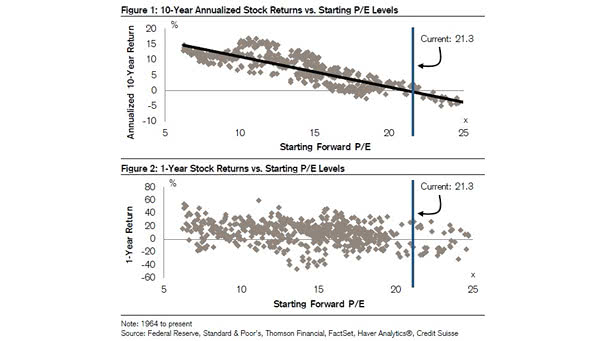
10-Year Annualized Stock Returns vs. Starting P/E Levels Higher P/Es tend to lead to weaker long-term returns. Image: Credit Suisse
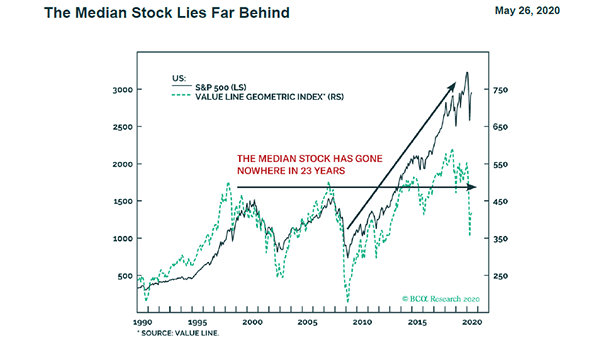
S&P 500 vs. Value Line Geometric Index (Median U.S. Stocks) The Value Line Geometric Index (median U.S. stock) has gone nowhere in 23 years! Image: BCA Research
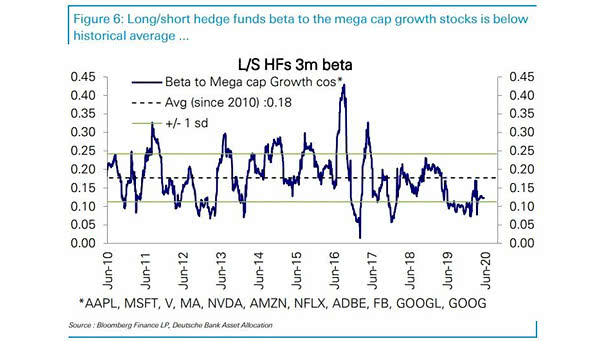
Long/Short Hedge Funds Beta to Mega Cap Growth Stocks Hedge funds aren’t chasing the current market rally, as long/short hedge funds beta to the mega growth stocks is below historical average. Image: Deutsche Bank Asset Allocation
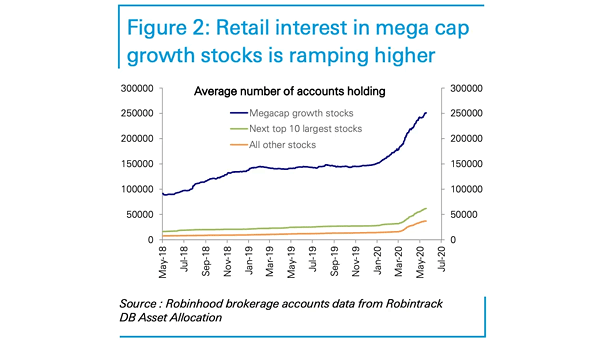
Average Number of Retail Accounts Holding and Megacap Growth Stocks In the aftermath of the coronavirus pandemic, the number of retail accounts holding mega-cap growth stocks has surged overall. Image: Deutsche Bank Asset Allocation
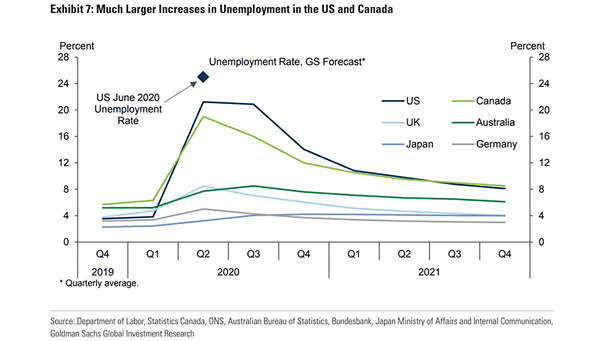
Unemployment Rate Forecast Goldman Sachs expects the U.S. unemployment rate to reach 25% in Q2, a much higher peak than in other advanced economies. Image: Goldman Sachs Global Investment Research
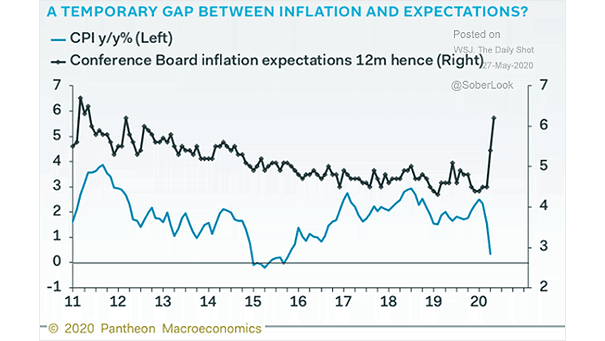
CPI vs. Conference Board Inflation Expectations Coordinated monetary and fiscal easing should lift inflation higher in this cycle. Image: Pantheon Macroeconomics
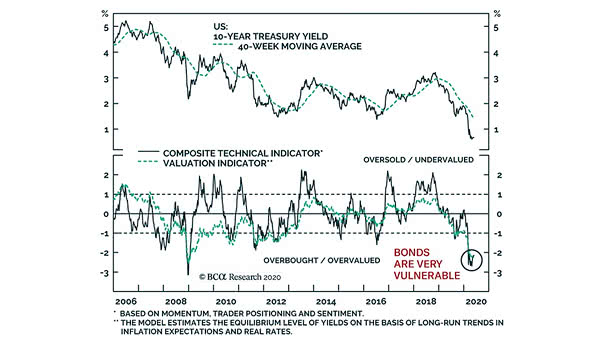
Valuation and U.S. 10-Year Treasury Yield Are bonds risky? This chart suggests that U.S. Treasury bonds are very vulnerable to downside risks. Image: BCA Research
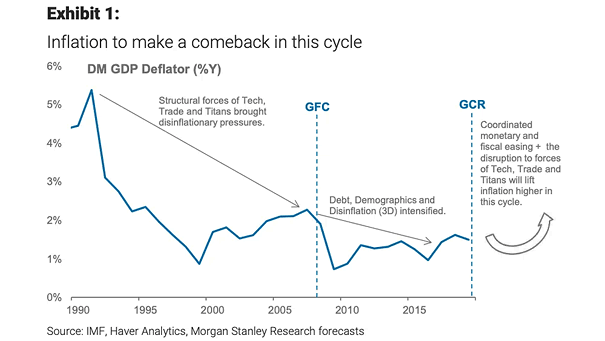
Inflation in this Cycle (DM GDP Deflator) Morgan Stanley expects the return of inflation after the Great COVID-19 Recession (GCR). Image: Morgan Stanley Research
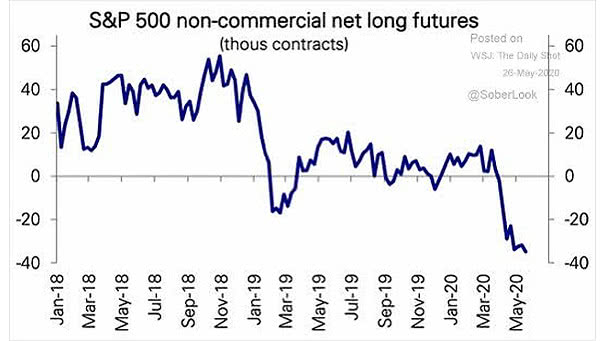
S&P 500 Non-Commercial Net Long Futures Speculative futures in S&P 500 are net short. Image: Deutsche Bank
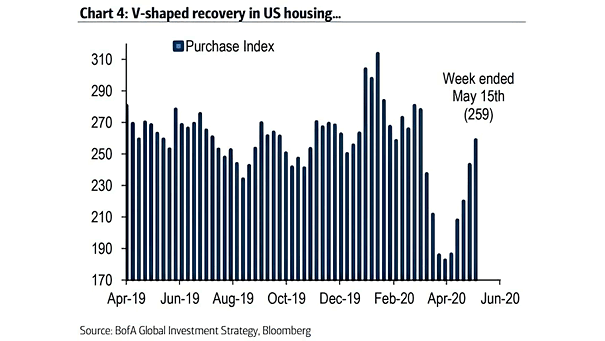
U.S. Housing Market This chart suggests that the U.S. housing market has already started to recover. Image: BofA Global Investment Strategy