Bitcoin Market Price and Intrinsic Value
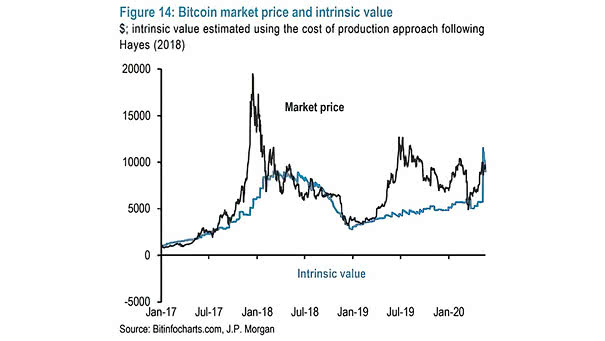
Bitcoin Market Price and Intrinsic Value This chart suggests Bitcoin’s intrinsic value using the cost of production approach following Hayes. Image: J.P. Morgan
Bitcoin Market Price and Intrinsic Value This chart suggests Bitcoin’s intrinsic value using the cost of production approach following Hayes. Image: J.P. Morgan
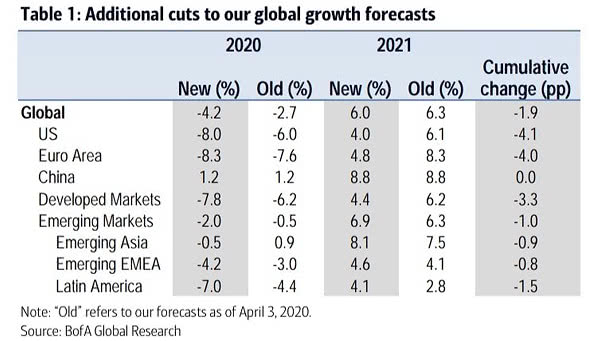
Global GDP Growth Forecasts BofA has revised lower 2020 GDP growth for 28 of 43 countries. Image: BofA Global Research
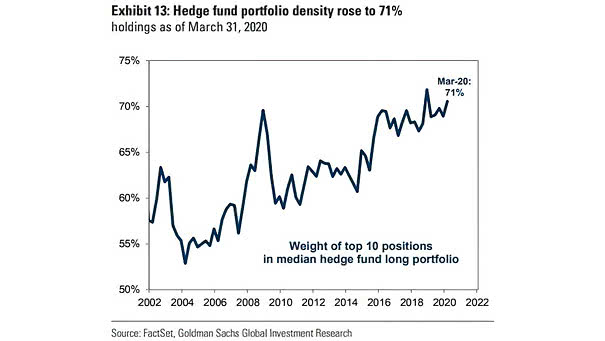
Weight of Top 10 Positions in Median Hedge Fund Long Portfolio The average hedge fund holds 71% of its long portfolio in its top 10 positions. This is one percentage point below the record high of 72% reached in 2019. Image: Goldman Sachs Global Investment Research
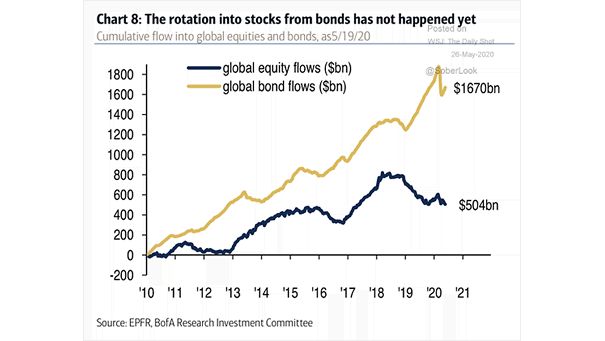
Cumulative Flow into Global Equities and Bonds So far, there is no sign of a great rotation into stocks from bonds. Image: BofA Research Investment Committee
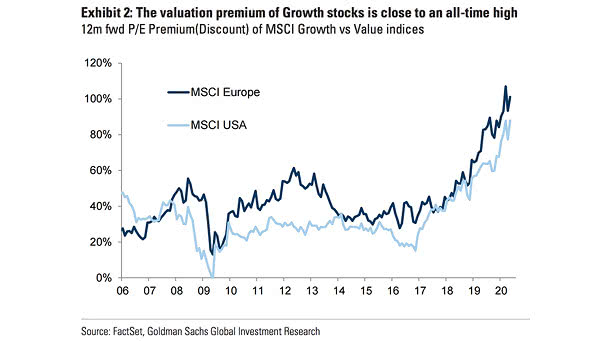
Valuation – P/E Premium of MSCI Growth vs. Value Indices The valuation premium of growth stocks vs. value stocks is close to an all-time high. Image: Goldman Sachs Global Investment Research
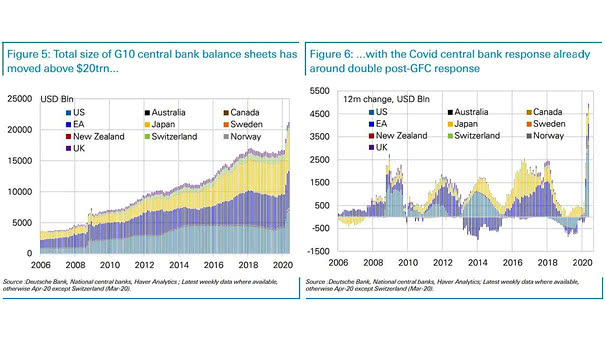
G10 Central Bank Balance Sheets The total size of G10 central bank balance sheets has now surpassed $20 trillion. Image: Deutsche Bank
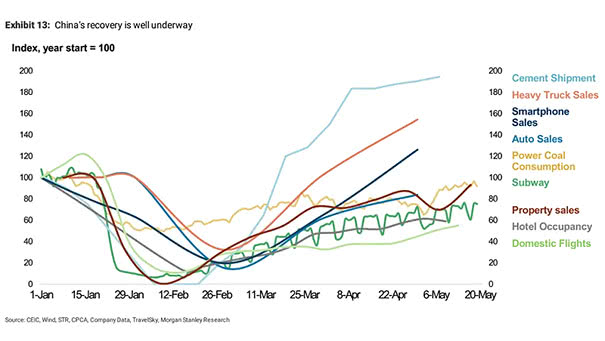
China Recovery China recovery is well underway, suggesting a quick economic recovery. Image: Morgan Stanley Research
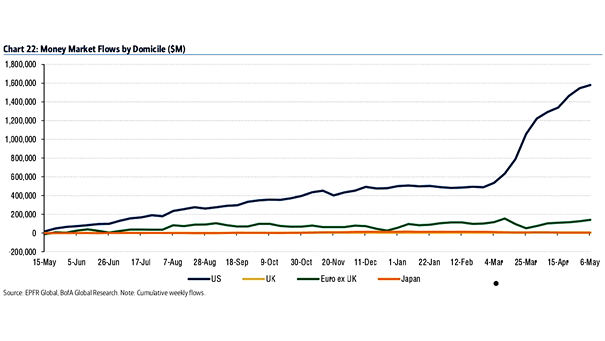
Cumulative Weekly Money Market Flows by Domicile Record money market flows in the United States, as the coronavirus pandemic leads to a flight to quality. Image: BofA Global Research
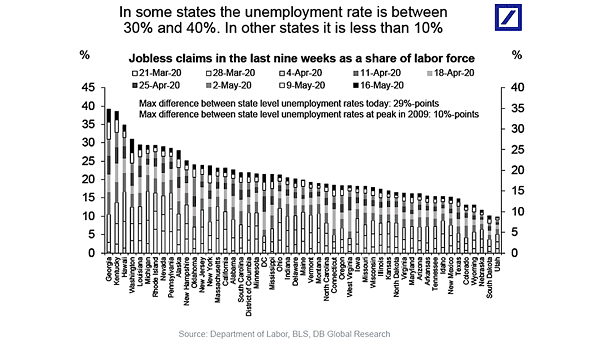
U.S. Unemployment Rate – Jobless Claims in the Last Nine Weeks as a Share of Labor Force This chart shows the wave of job losses in the United States. Image: Deutsche Bank Global Research
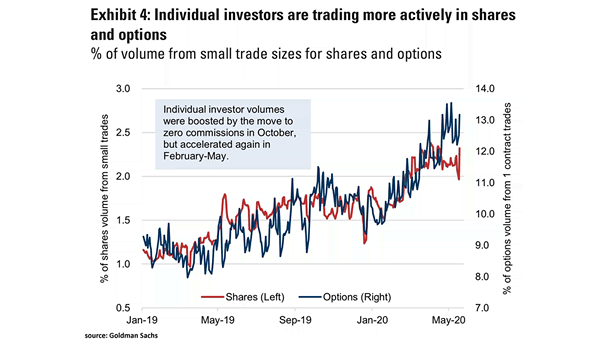
Individual Investors Are Trading More Actively in Shares and Options The move to zero commissions in October and the lockdowns boosted individual investor volumes. Image: Goldman Sachs Global Investment Research
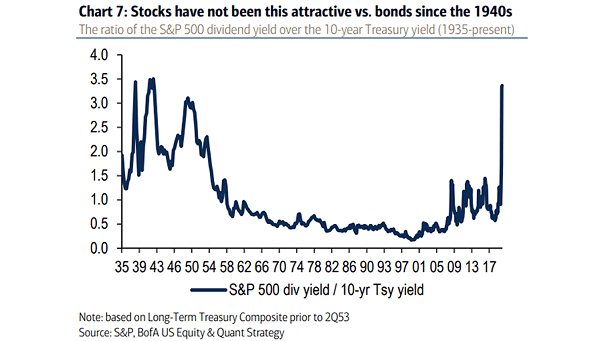
Ratio of the S&P 500 Dividend Yield over the 10-Year Treasury Yield Chart suggesting that stocks have not been this attractive relative to bonds since the 1940s. Image: BofA US Equity & Quant Strategy