Global Cumulative Weekly Flow: Fixed Income vs. Equities
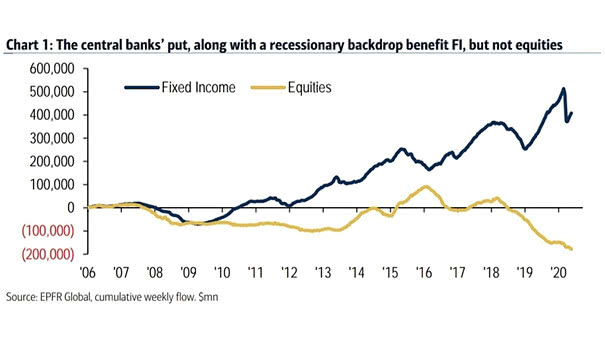
Global Cumulative Weekly Flow: Fixed Income vs. Equities This chart highlights once again investors’ strong preference for bonds. Image: BofA Global Research
Global Cumulative Weekly Flow: Fixed Income vs. Equities This chart highlights once again investors’ strong preference for bonds. Image: BofA Global Research
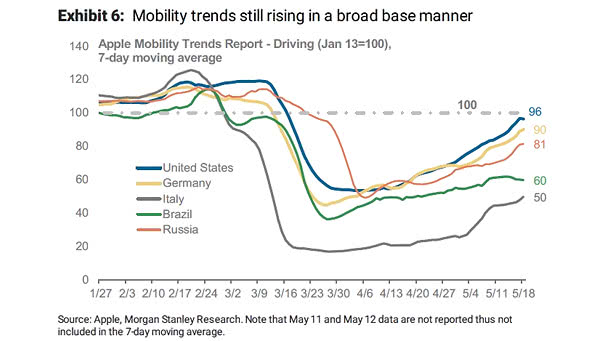
Indicator – Mobility Trends (Driving) This chart suggests that mobility (driving) in the United States is now back to January levels. Image: Morgan Stanley Research
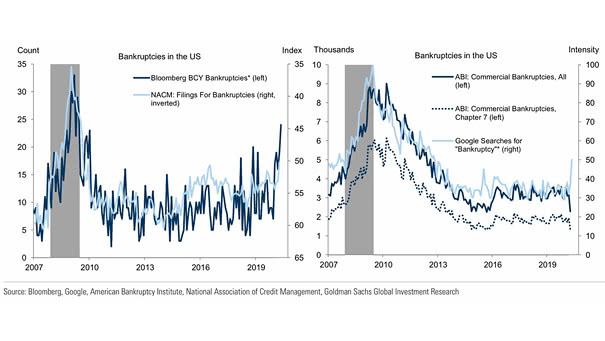
Bankruptcies and Coronavirus Crisis Filings for U.S. bankruptcies and Google searches for “Bankruptcy” are up. Image: Goldman Sachs Global Investment Research
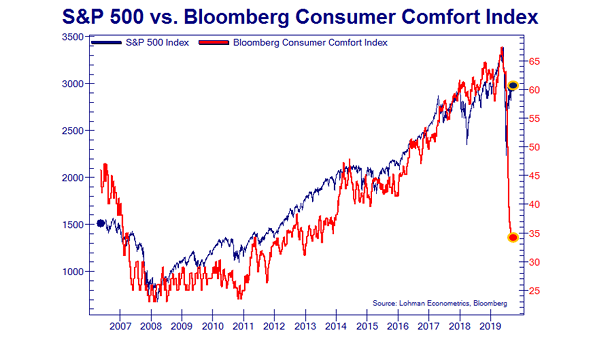
S&P 500 vs. Bloomberg Consumer Comfort Index This chart highlights the wide divergence between the S&P 500 and the growing anxiety among Americans on the condition of the U.S. economy, their personal finances and the buying climate. Image: Lohman Econometrics
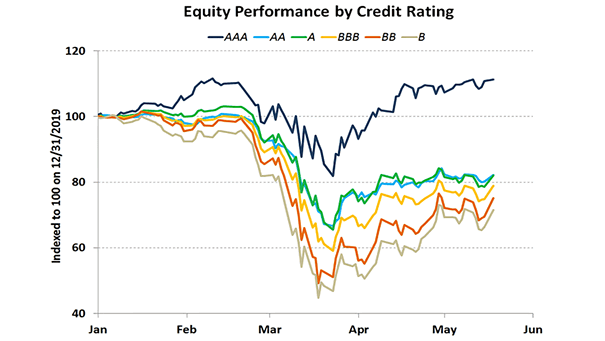
Equity Performance by Credit Rating This chart shows the impact of credit ratings on stock returns since the beginning of the year. Image: Ken Fisher, Fisher Investments
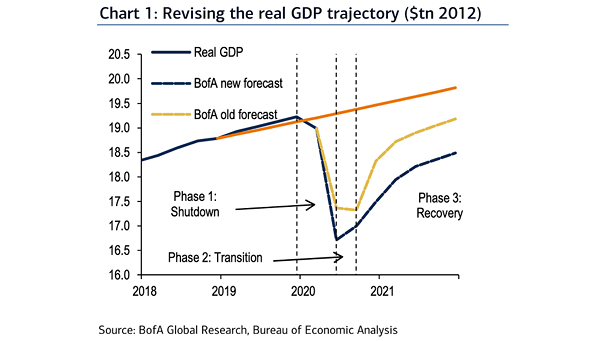
Revising the U.S. Real GDP Trajectory BofA is revising down the path of U.S. real GDP. Image: BofA Global Research
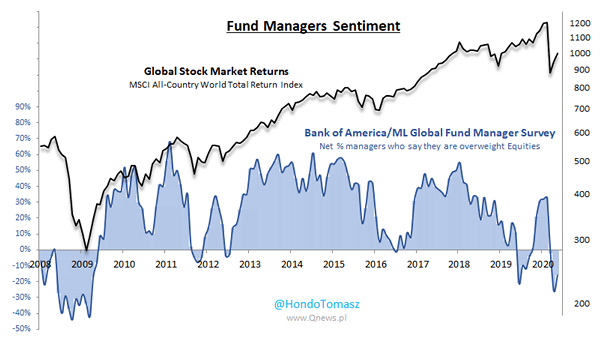
Fund Managers Sentiment and Global Stock Market Returns (MSCI ACWI) Are fund managers too bearish? Two-thirds of global fund managers say this is a bear market rally. Image: Hondo Tomasz
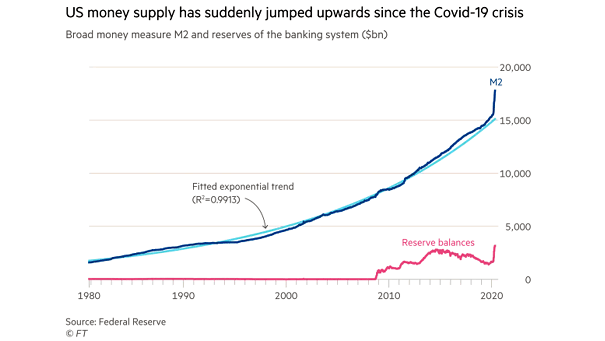
U.S. Money Supply M2 and Reserves of the Banking System U.S. money supply M2 shows significant jumps in growth, which could affect future inflation. Image: Financial Times
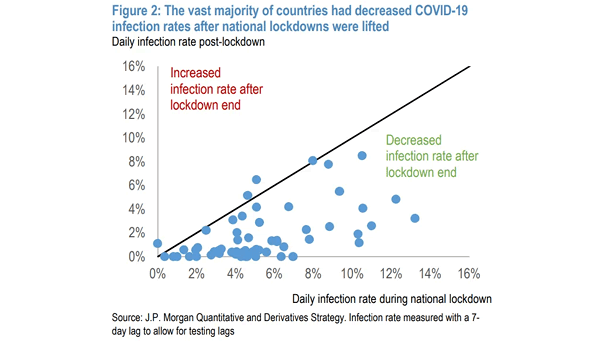
Daily Coronavirus Infection Rate Post-Lockdown On the positive side, this chart shows a decrease in COVID-19 infection rates after countries eased national lockdowns. Image: J.P. Morgan
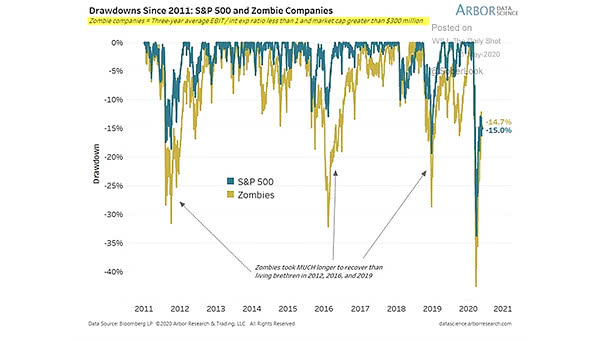
Drawdowns Since 2011: S&P 500 and Zombie Companies Since the March lows, zombie companies have outperformed the S&P 500 by a wide margin in April and May. Image: Arbor Research & Trading LLC
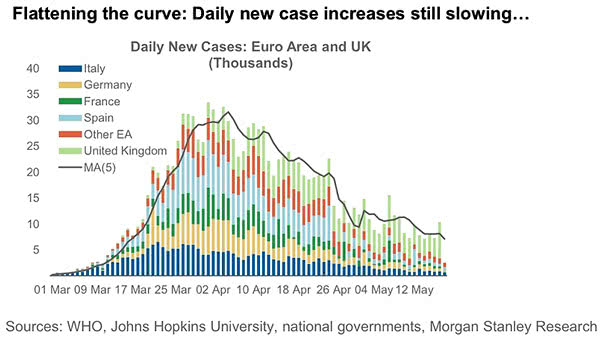
Daily New Cases of Coronavirus: Euro-Area and UK Daily new COVID-19 case increases have significantly slowed down. Lockdowns are gradually lifted across Europe and activity is increasing. Image: Morgan Stanley Research