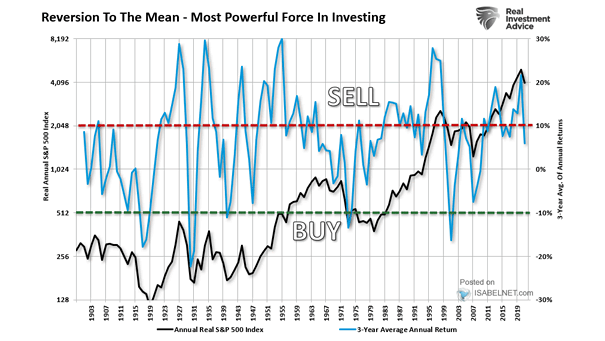
Annual Real S&P 500 Index and 3-Year Average Annual Return

Annual Real S&P 500 Index and 3-Year Average Annual Return The S&P 500 sits about 18% above its three‑year average, a strong run by any measure, but past rallies this sharp rarely come without some turbulence ahead. Image: Real Investment Advice
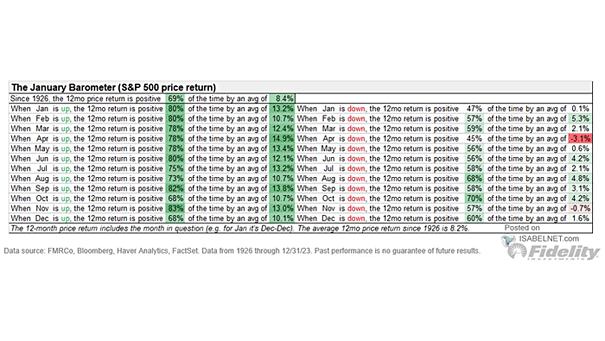
January Barometer and S&P 500 Index Return Rest of Year

January Barometer and S&P 500 Index Return Rest of Year When U.S. stocks end January in the green, momentum usually keeps rolling. Historically, a positive January has been followed by above-average returns 87% of the time, with a median return of 13.4% over the next 11 months. Image: Carson Investment Research

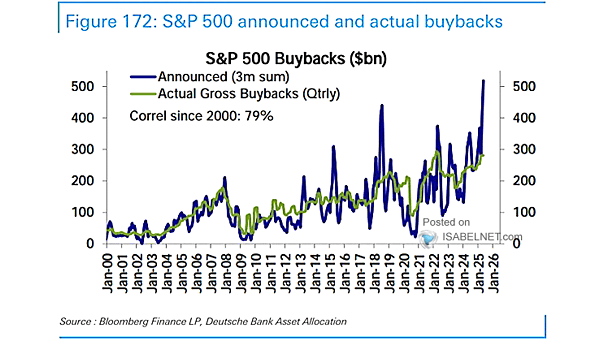
S&P 500 Buybacks

S&P 500 Buybacks S&P 500 buybacks have lost some steam lately, but most analysts view it as a short breather following record highs, not a sign that corporate cash is drying up. Image: Deutsche Bank Asset Allocation

S&P 500 Performance Around First Fed Rate Cut

S&P 500 Performance Around First Fed Rate Cut When the economy stays firm, Fed rate cuts have a history of boosting stocks and the S&P 500’s current run is no exception. Image: TS Lombard

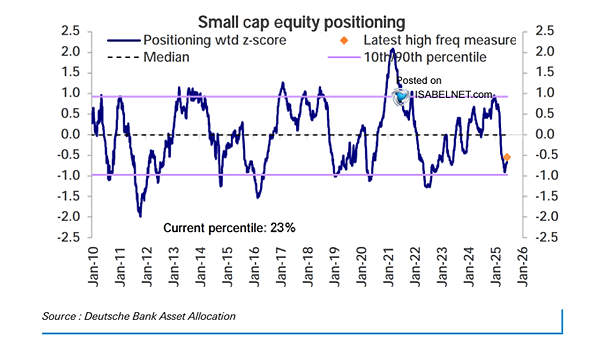
Small Cap Equity Positioning

Small Cap Equity Positioning Investor appetite for small-caps stays strong in early 2026, while positioning at the 63rd percentile leaves space for further upside. Image: Deutsche Bank Asset Allocation

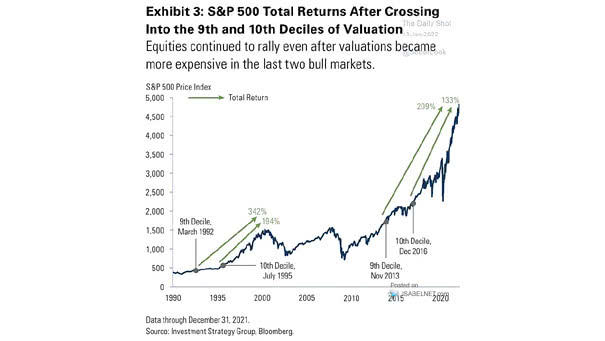
S&P 500 Total Returns After Crossing Into the 9th and 10th Deciles of Valuation

S&P 500 Total Returns After Crossing Into the 9th and 10th Deciles of Valuation U.S. equities have a history of pushing higher despite lofty valuations. While nervous talk of a tech bubble persists, analysts point to strong earnings and low debt as reasons this rally could run longer. Image: Goldman Sachs Global Investment Research

S&P 500 Shiller CAPE vs. Subsequent Calendar-Year Total Return

S&P 500 Shiller CAPE vs. Subsequent Calendar-Year Total Return In the short run, the Shiller CAPE ratio often gets lost in the market’s noise. Over five to ten years, however, its warning grows clearer: the higher the valuations, the thinner the returns. Image: Goldman Sachs Global Investment Research

S&P 500 Index Average Intra-Year Drawdown During Midterm Elections

S&P 500 Index Average Intra-Year Drawdown During Midterm Elections Midterm years often shake confidence on Wall Street. The S&P 500 usually slides 18% on average at some point during the year, but those downturns tend to open the door to compelling buying opportunities. Image: Bloomberg

Fed Funds Rate and Fed Funds Futures

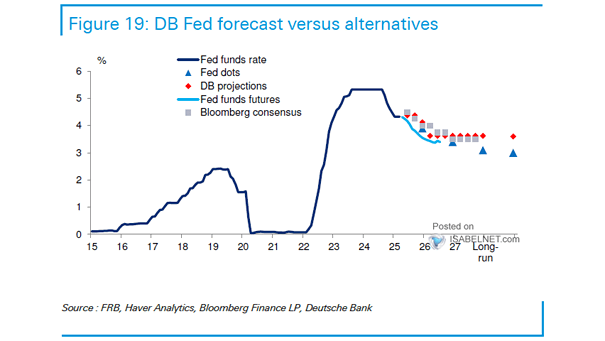
Fed Funds Rate and Fed Funds Futures Lower tariff rates and a dovish shift at the Fed could set the stage for rate cuts below 3.5% by year‑end, assuming inflation keeps drifting toward target and growth stays soft. Image: Deutsche Bank

Global Stocks – MSCI AC World Local Index

Global Stocks – MSCI AC World Local Index Citigroup strategists are betting on a 10% rise in global equities this year, backed by a gentle economic slowdown, stronger earnings forecasts, and fresh AI tailwinds. Image: Bloomberg

U.S. M2 Money Creation by Year

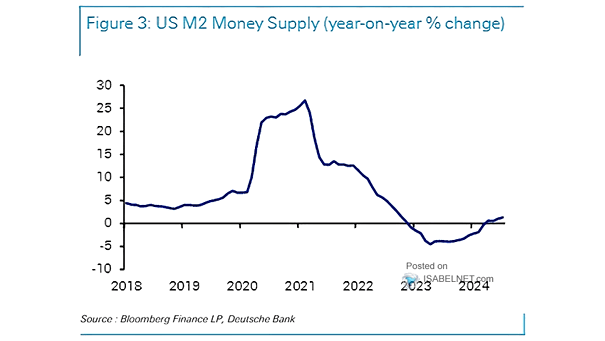
U.S. M2 Money Creation by Year All signs point to a 2026 liquidity wave: bigger money funds, solid bank credit, and $40 billion a month from the Fed in T‑bill buys. That could juice reserves, pump up nearly $2 trillion in money creation, and keep stocks humming. Image: J.P. Morgan Flows and Liquidity