U.S. Current Account Balance as a % of GDP
U.S. Current Account Balance as a % of GDP The U.S. current account deficit has been on a widening path since 2019 and looks poised to stay elevated into 2026. Image: Gavekal, Macrobond
U.S. Current Account Balance as a % of GDP The U.S. current account deficit has been on a widening path since 2019 and looks poised to stay elevated into 2026. Image: Gavekal, Macrobond
Hyperscaler Capex Hyperscalers are on pace to spend $4 trillion on capex by 2030, more than ten times what the Apollo program cost in today’s dollars, a bet that leaves little room for error. Image: Bloomberg
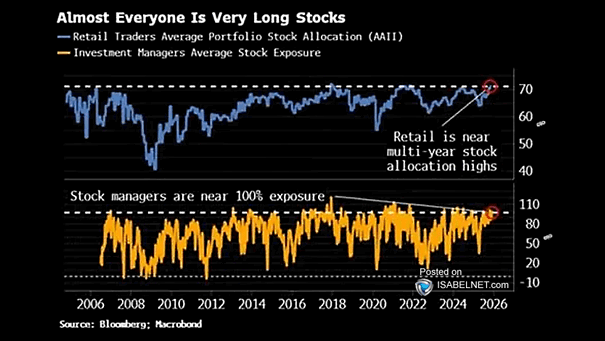
Retail Traders Average Portfolio Stock Allocation and Investment Managers Average Stock Exposure Over the past two decades, periods when both retail and professional traders were this heavily long have often been followed by S&P 500 underperformance in the following one to three months. Image: Bloomberg
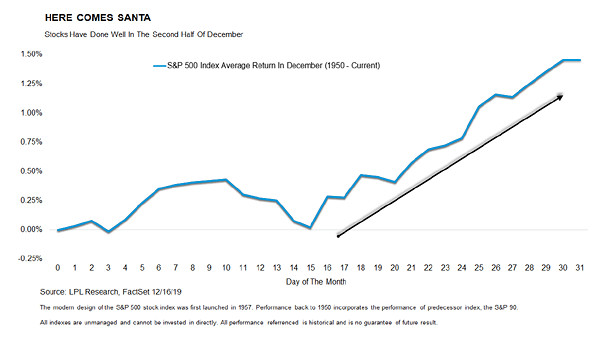
S&P 500 Average Return in December With the holidays in sight, buyers are starting to reappear. History shows U.S. stocks often find a floor around mid-December and rally into year-end, a seasonal lift the bulls never seem to tire of. Image: Carson Investment Research
Gold vs. 1970s Gold has been shining bright, but it’s nowhere near the late-1970s gold rush. Investors might want to keep an open mind. Image: Bloomberg
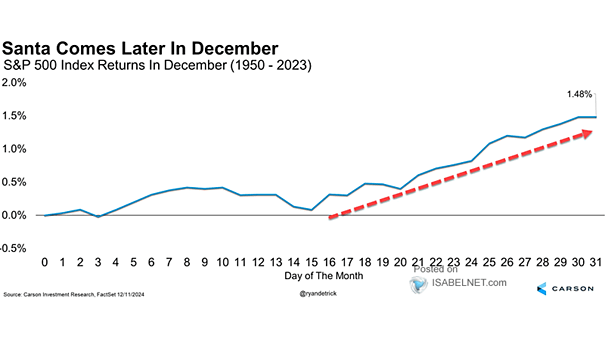
Seasonality – S&P 500 Index Returns in December As the holidays approach, buyers usually return and the year-end rally tends to pick up speed in the second half of December. Historically, U.S. stocks have climbed an average of 1.4% during the month. Image: Carson Investment Research
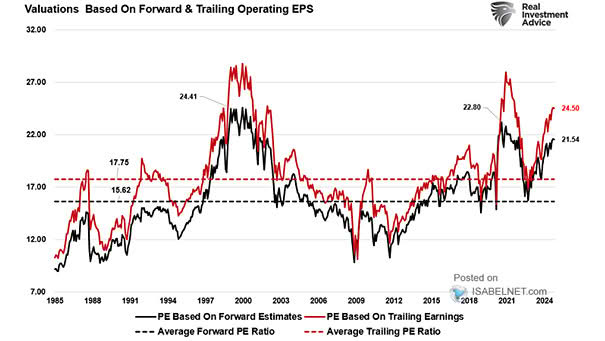
S&P 500 Valuation Multiples With valuations lofty and expectations running high, U.S. stocks look exposed if earnings or the economy disappoint. Image: Real Investment Advice
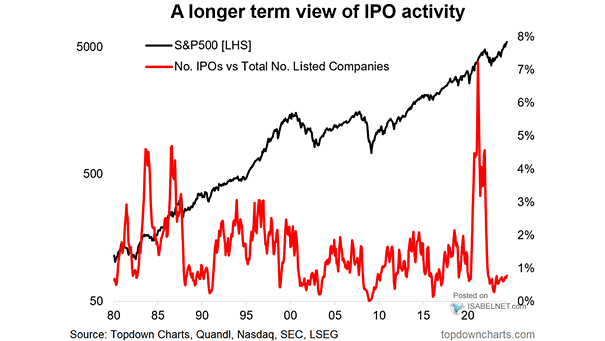
S&P 500 and U.S. IPO Activity The IPO market is showing signs of life. A pickup in U.S. listings, paired with improving sentiment in global equities, points to a more bullish medium-term outlook for new issues. Image: Topdown Charts
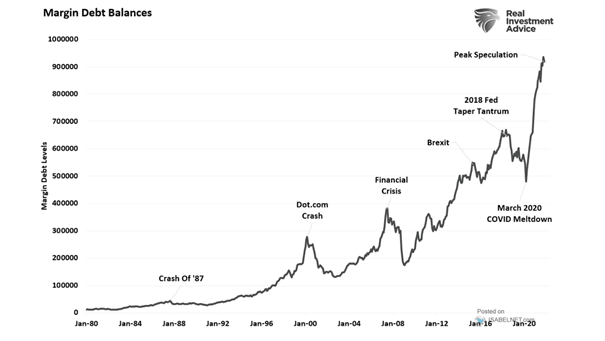
Margin Debt Balances – YoY % Change Margin debt on the NYSE has surged past $1.1 trillion, up nearly 40% YoY, marking one of the fastest spikes on record. Such rapid increases in borrowing, outpacing overall market gains, have often preceded market peaks. Image: Real Investment Advice
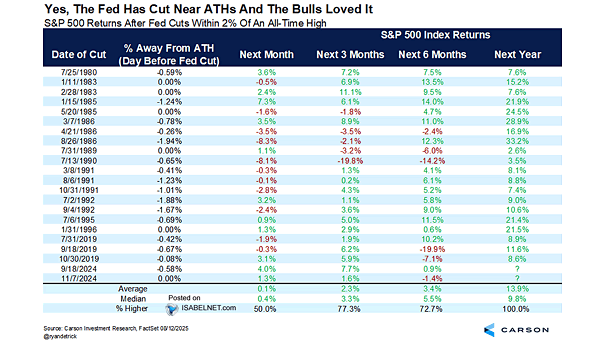
S&P 500 Returns After Fed Cuts Within 2% of an All-Time High Bears are losing ground as history leans bullish. Since 1980, when the Fed has eased policy while the S&P 500 traded within 2% of an all‑time high, the index has risen every time in the next 12 months, averaging a 14.2% gain Image:…
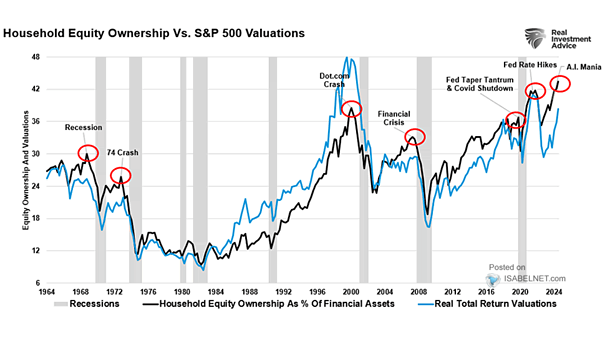
U.S. Household Equity Ownership vs. S&P 500 Index U.S. households have never been this heavily invested in stocks. The higher the concentration, the greater the risk that a market pullback hits both confidence and consumption, reversing wealth effects. Image: Real Investment Advice