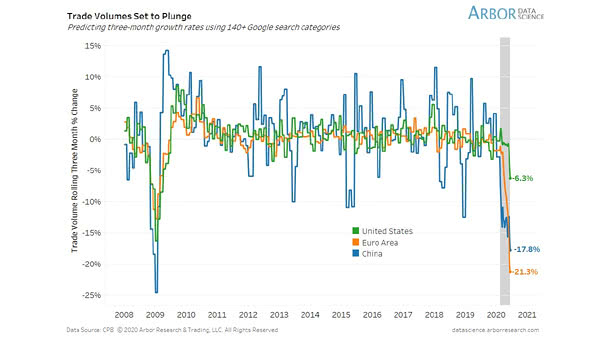
Trade Volumes
Trade Volumes Chart suggesting that trade volumes are expected to fall significantly. Image: Arbor Research & Trading LLC
Trade Volumes Chart suggesting that trade volumes are expected to fall significantly. Image: Arbor Research & Trading LLC
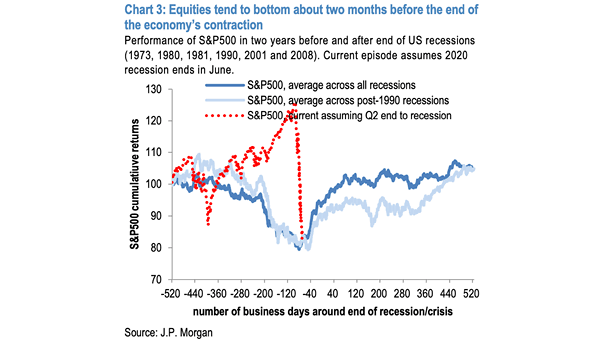
Performance of S&P 500 in Two Years Before and After End of U.S. Recessions This chart suggests that the current episode assumes 2020 recession ends in June, as equities tend to bottom about two months before the end of the economy contraction. Image: J.P. Morgan
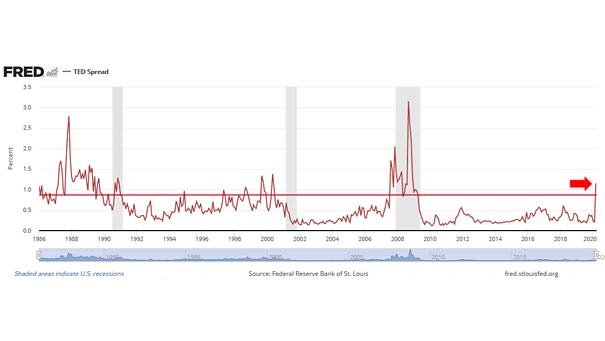
U.S. TED Spread The TED spread (spread between 3-month LIBOR and 3-month Treasury bill) shows that financial conditions are tightening at the fastest pace since the 2008 crisis.
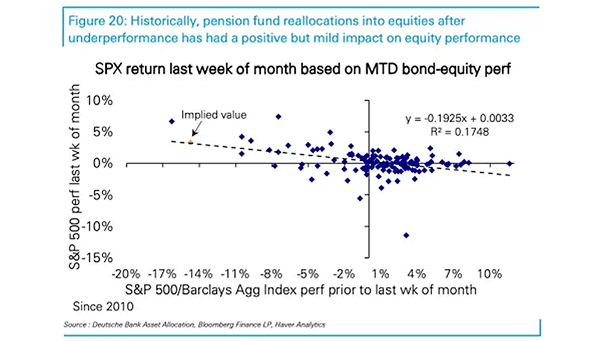
S&P 500 Return Last of Month Based on MTD Bond-Equity Performance Historically, pension fund rebalancing into equities has had a mild impact on performance. Image: Deutsche Bank Asset Allocation
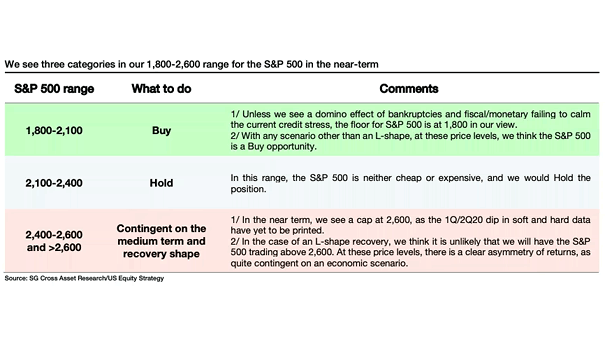
S&P 500 Range in the Near-Term This table suggests a 1,800-2,600 range for the S&P 500 in the near-term. Image: Societe Generale Cross Asset Research
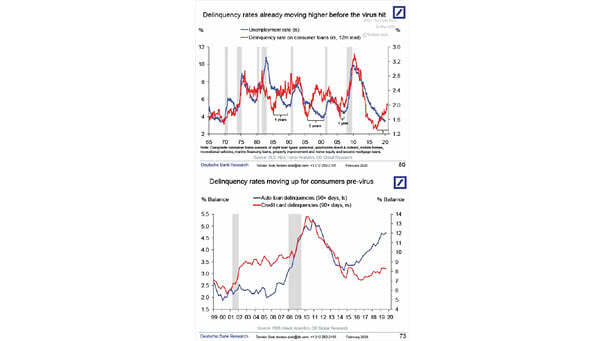
U.S. Delinquency Rate and Unemployment Rate Hopes of a V-shaped recovery are fading, as delinquency rates were already moving higher before the virus hit. Image: Deutsche Bank Global Research
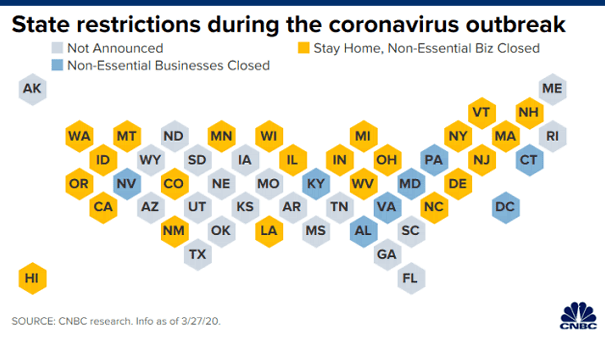
U.S. States Restrictions during the Coronavirus Outbreak Twenty-three states have closed non-essential businesses and have issued stay-at-home orders. Image: CNBC
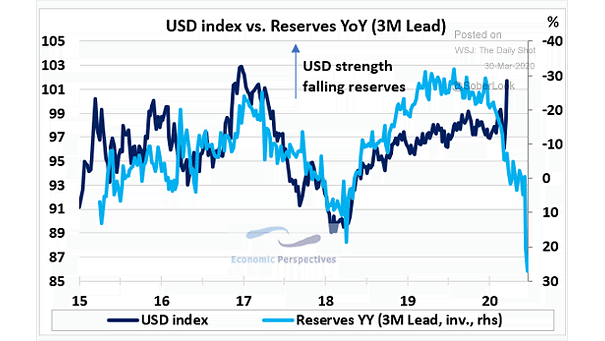
U.S. Dollar Index vs. Reserves (Leading Indicator) This chart suggests that reserves tend to lead the U.S. dollar index by three months. Lower U.S. dollar ahead? Image: Economic Perspectives
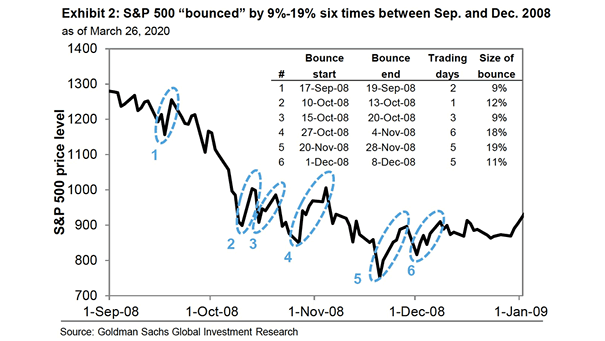
Bear Market Rally – S&P 500 “Bounced” in 2008 To put the current bear market rally in perspective, this chart shows that the S&P 500 “bounced” six times by 9% to 19% in 2008. Image: Goldman Sachs Global Investment Research
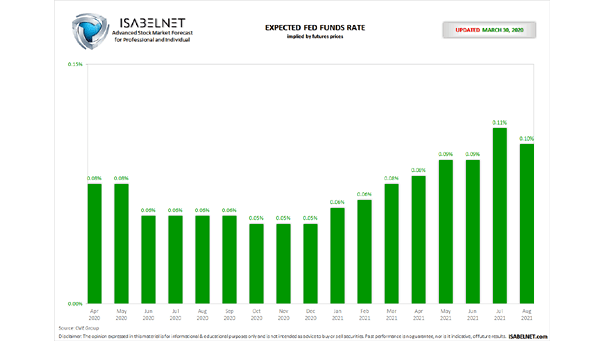
Expected Fed Funds Rate Fed funds futures for January 2021 imply an expected rate of 1.18%. Click the Image to Enlarge
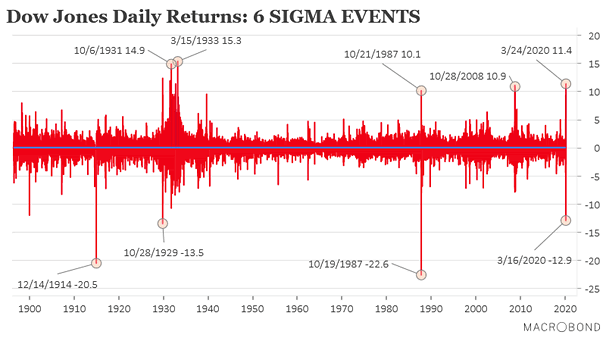
Dow Jones Daily Returns and 6 Sigma Events As the chart shows, an event of 6 standard deviations above or below the mean, is extremely rare. Image: Macrobond Financial