Percent of BofA Bear Market Signposts Triggered
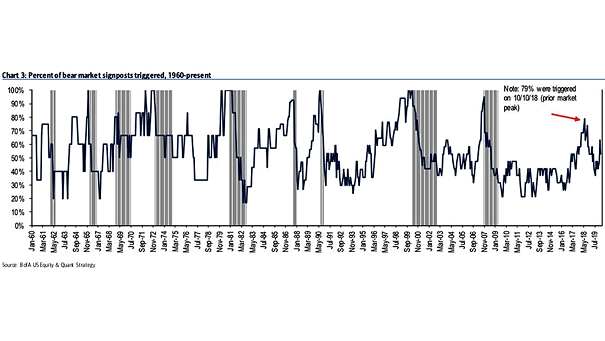
Percent of BofA Bear Market Signposts Triggered 79% of BofA bear market signposts were triggered on October 10, 2018 vs. 53% currently. Image: BofA US Equity & US Quant Strategy
Percent of BofA Bear Market Signposts Triggered 79% of BofA bear market signposts were triggered on October 10, 2018 vs. 53% currently. Image: BofA US Equity & US Quant Strategy
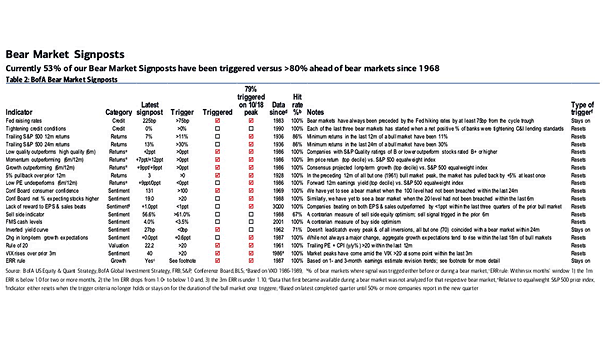
BofA Bear Market Signposts Currently, 10 bear market signposts have been triggered vs. 15 on 10/18 market peak. Image: BofA US Equity & Quant Strategy Click the Image to Enlarge
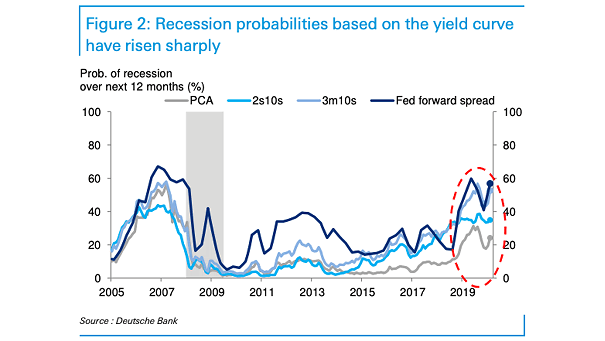
U.S. Recession Probabilities Based on the Yield Curve The probability of a U.S. recession over the next 12 months, based on the yield curves, has risen significantly. Image: Deutsche Bank
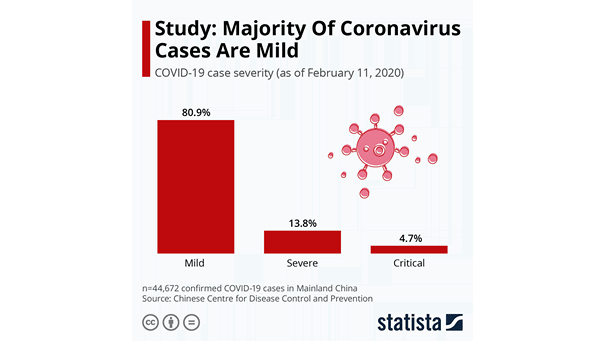
Coronavirus Case Severity Over 80% of coronavirus cases are mild. This could explain why it is spreading so rapidly. Image: Statista
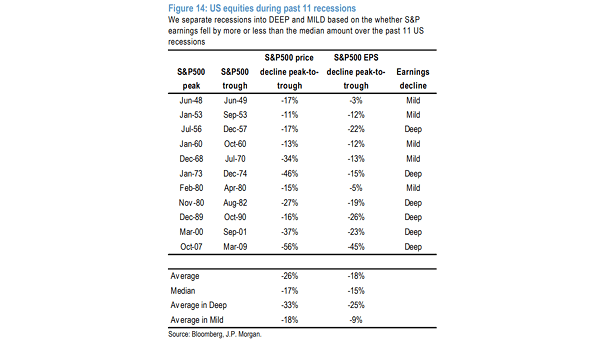
U.S. Equities During Past 11 Recessions The S&P 500 has declined by 15% from its peak. The average decline over the past 11 recessions is 26%. U.S. equity markets price in 15/26 = 57% chance of an average recession. Image: J.P. Morgan
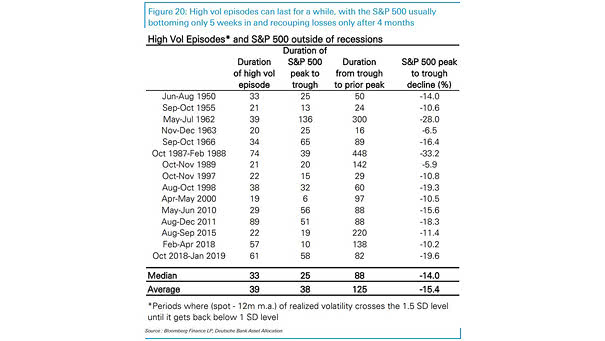
High Volatility Episodes and S&P 500 Outside of Recessions During high volatility episodes, the S&P 500 has taken four months to recover outside of recessions. Image: Deutsche Bank Asset Allocation
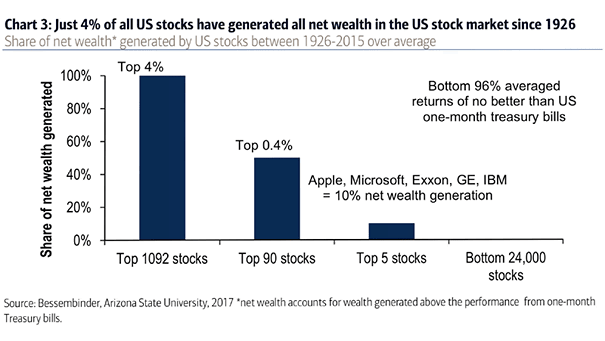
Share of Net Wealth Generated by U.S. Stocks This chart shows that only a minority of stocks create value over long periods of time. Image: BofA Global Investment Strategy
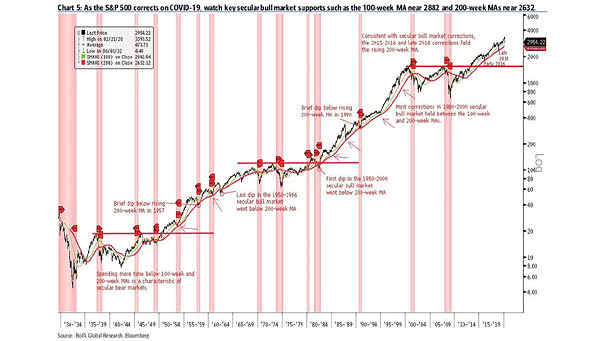
S&P 500 and Secular Bull Market Corrections Chart suggesting that the 100-week MA and the 200-week MA are key secular market supports. Image: BofA Global Research
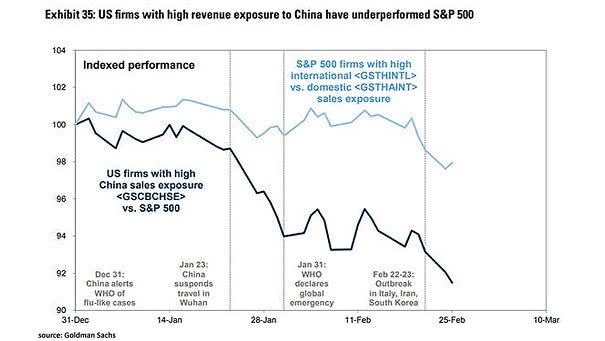
U.S. Firms with High China Sales Exposure vs. S&P 500 Chart showing that U.S. stocks with high revenue exposure to China have suffered greater losses. Image: Goldman Sachs Global Investment Research
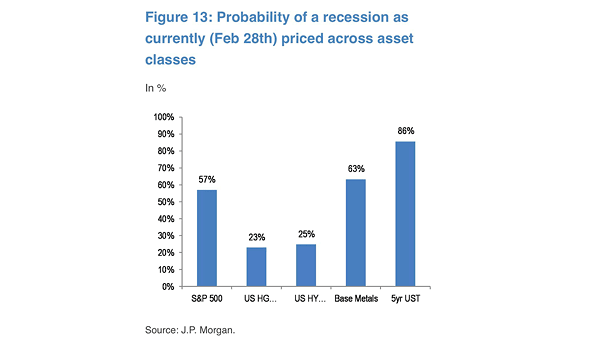
Probability of a U.S. Recession as Currently Priced Across Asset Classes Chart suggesting that the S&P 500 implies a 57% chance of recession, while 5-year U.S. Treasuries imply a 86% chance of recession. Image: J.P. Morgan
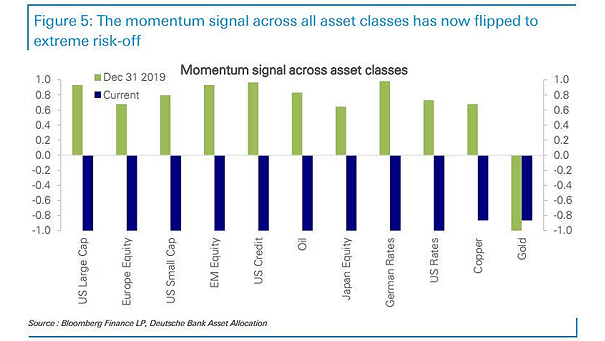
Momentum Signal Across Asset Classes Momentum signals across all asset classes have flipped to extreme risk-off. Image: Deutsche Bank Asset Allocation