Valuation – S&P 500 vs. MSCI EAFE and MSCI Emergind Markets
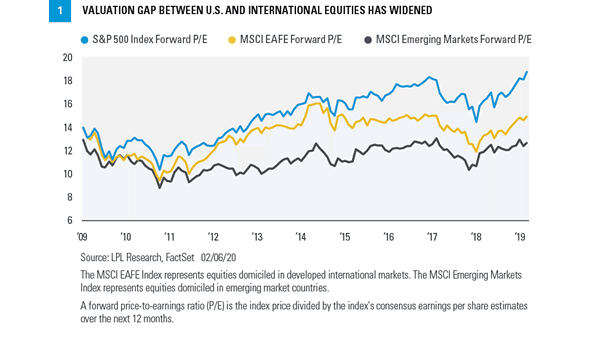
Valuation – S&P 500 vs. MSCI EAFE and MSCI Emergind Markets This chart highlights the valuation gap between U.S. and international equities. Image: LPL Research
Valuation – S&P 500 vs. MSCI EAFE and MSCI Emergind Markets This chart highlights the valuation gap between U.S. and international equities. Image: LPL Research
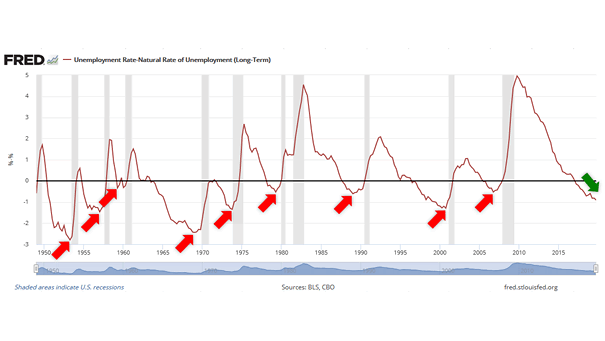
U.S. Unemployment Rate Minus U.S. Natural Rate of Unemployment and Recessions The unemployment rate minus the natural rate of unemployment has been negative for 34 months, and tends to bottom before a recession.
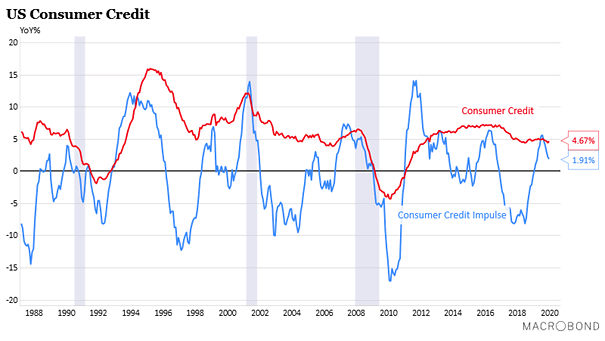
U.S. Consumer Credit The current downtrend in US consumer credit impulse could suggest a scenario of slowing growth this year. Image: Macrobond Financial
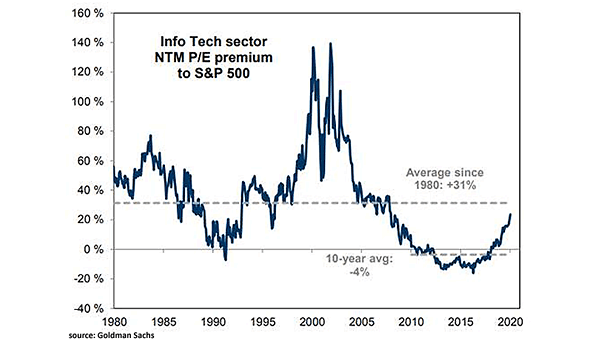
Info Tech Sector NTM P/E Premium to S&P 500 Is the tech sector expensive relative to the S&P 500? Image: Goldman Sachs Global Investment Research
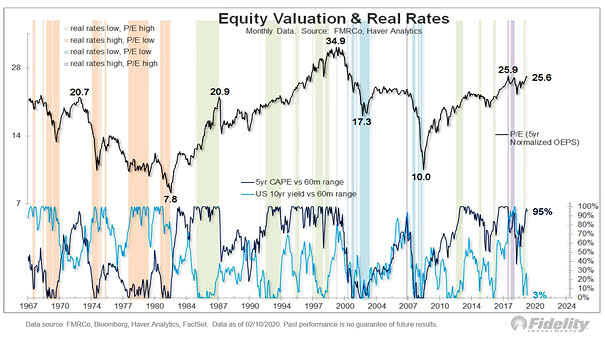
U.S. Equity Valuation and Real Rates This chart highlights the various regimes for rates and equities over time. Image: Fidelity Investments
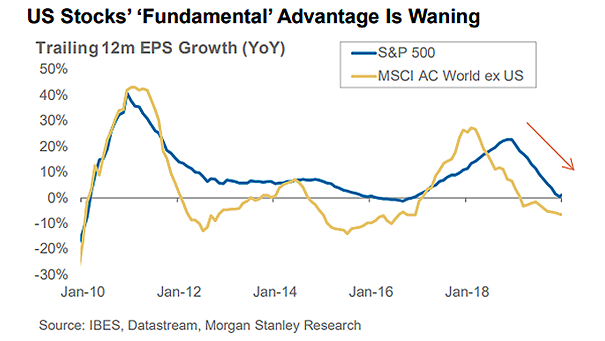
Trailing 12 Month EPS Growth: S&P 500 vs. MSCI AC World ex U.S. Chart suggesting that the “fundamental” advantage of U.S. stocks is diminishing. Image: Morgan Stanley Research
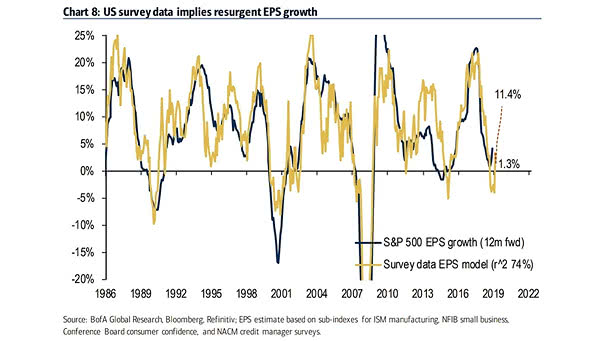
U.S. Survey Data and EPS Growth BofA’s model suggests 11.4% U.S. EPS growth by the end of Q2 2020. Image: BofA Global Research
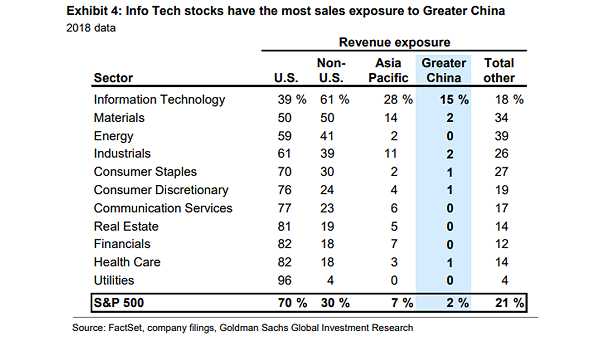
Info Tech Stocks and Sales Exposure to Greater China Stocks in the information technology sector have the most sales exposure to Greater China. Image: Goldman Sachs Global Investment Research
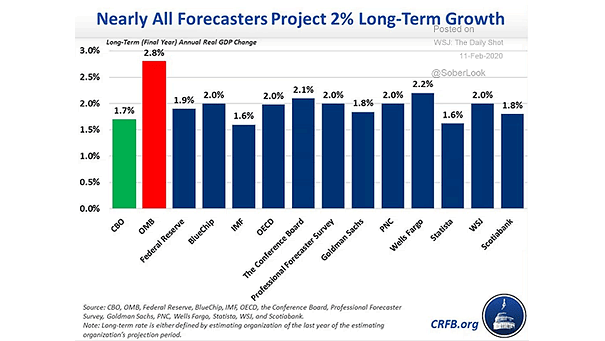
Long-Term Annual Real GDP Growth in the U.S. Most forecasters projects long-term real GDP growth of about 2% in the United States, except for the White House (Office of Management and Budget). Image: Committee for a Responsible Federal Budget
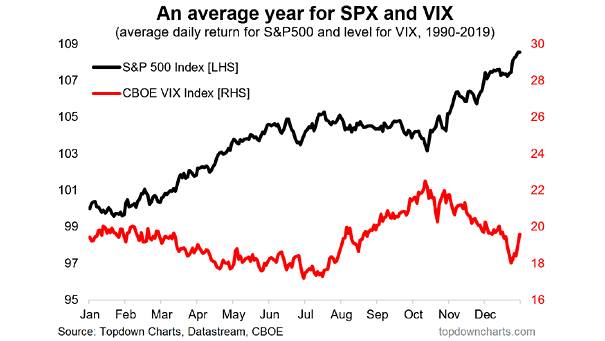
VIX and S&P 500 Seasonality The chart shows the seasonality map for the VIX and the S&P 500, and how they move in opposite directions. Image: Topdown Charts
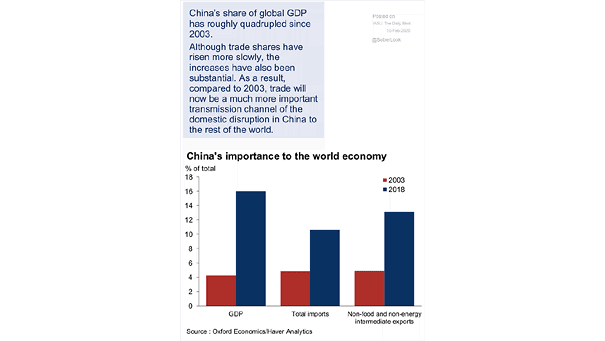
China’s Importance to the World Economy China plays a key role in the world economy, as China share of global GDP is much bigger today than it was in 2003. Image: Oxford Economics