U.S. Zombie Companies and Wilshire 5000
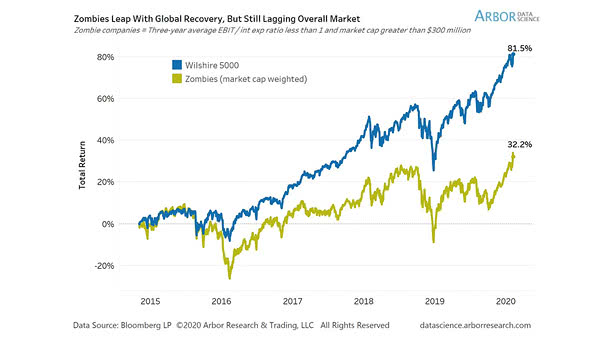
U.S. Zombie Companies and Wilshire 5000 Since the Fed ended QE in 2014, U.S. zombie companies have underperformed the stock market. Image: Arbor Research & Trading LLC
U.S. Zombie Companies and Wilshire 5000 Since the Fed ended QE in 2014, U.S. zombie companies have underperformed the stock market. Image: Arbor Research & Trading LLC

Probability of U.S. Recession vs. Initial Jobless Claims The probability of U.S. recession beginning within 12 months decreases. Image: J.P. Morgan
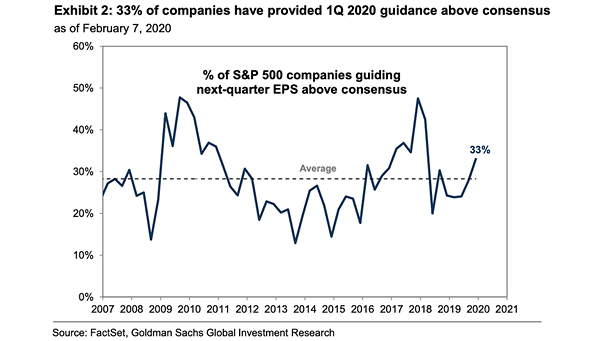
% of S&P 500 Companies Guiding Next-Quarter EPS above Consensus “33% of S&P 500 companies have provided 1Q 2020 guidance above consensus.” Image: Goldman Sachs Global Investment Research
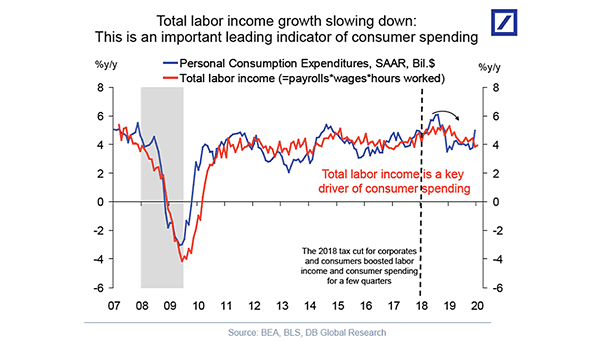
U.S. Total Labor Income and Personal Consumption Expenditures U.S. total labor income growth is slowing down and tends to lead consumer spending. Image: Deutsche Bank Global Research
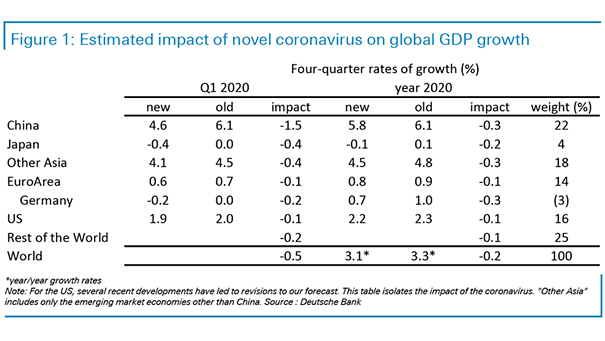
Estimated Impact of Novel Coronavirus on Global GDP Growth This year, the world economy may see growth 0.2% below what it would have been without the coronavirus. Image: Deutsche Bank
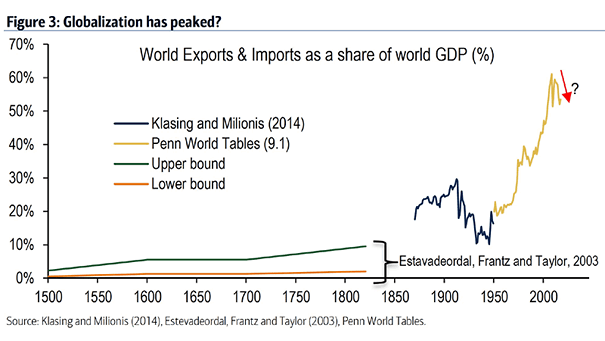
Globalization – World Exports and Imports as a Share of World GDP Is globalization stalling or reversing? This chart puts things into perspective. Image: BofA Global Research
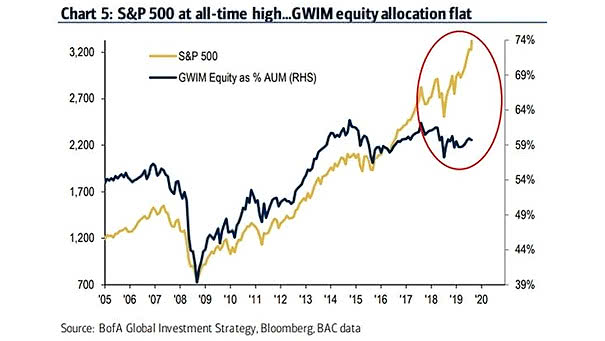
S&P 500 vs. Global Wealth and Investment Management Equity as % AUM Global Wealth and Investment Management (GWIM) equity allocation is flat, while the S&P 500 is at all-time high. Image: BofA Global Investment Strategy
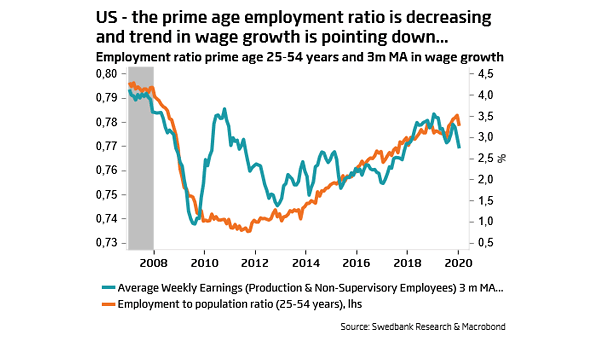
U.S. Prime Age Employment Ratio and Wage Growth Wage growth is sluggish, despite historically low unemployment in the United States. Image: Swedbank Research
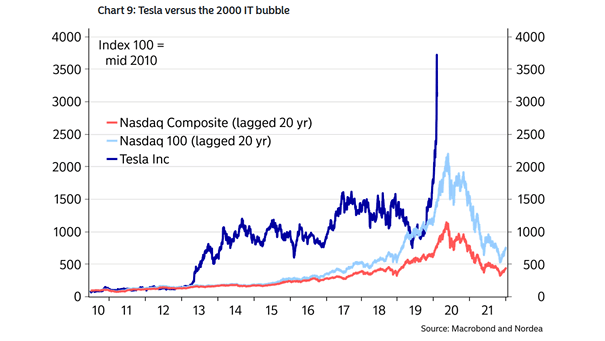
Tesla vs. The 2000 Internet Bubble While investors are betting on Tesla’s success, this chart is not a prediction on where Tesla stock is heading. Image: Nordea and Macrobond
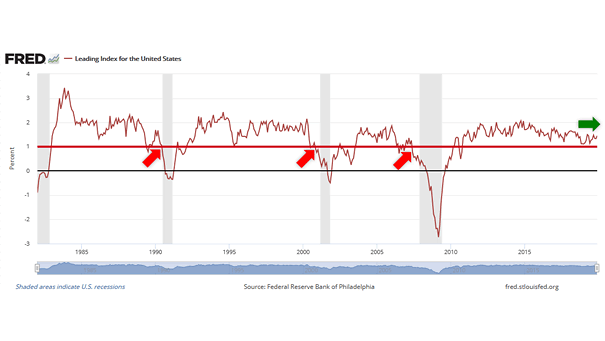
Are Fears About an Imminent Recession Overblown? Historically, a recession is coming when the Leading Index for the United States is below 1. Today, it stands at 1.37. “The leading index for each state predicts the six-month growth rate of the state’s coincident index. In addition to the coincident index, the models include other variables…
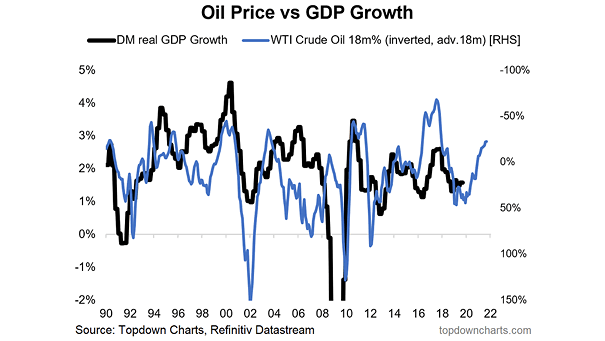
DM Real GDP and WTI Crude Oil (Leading Indicator) Chart suggesting that the 18-month rate of change of WTI crude oil (inverted) tends to lead DM real GDP by 18 months. Image: Topdown Charts