Coronavirus and Potential Scenarios
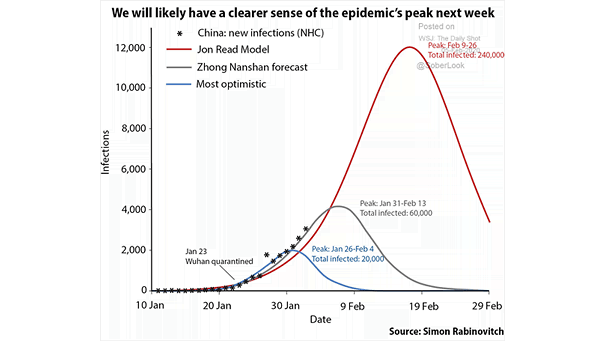
Coronavirus and Potential Scenarios Will the coronavirus outbreak soon reach its peak? Image: Gavekal
Coronavirus and Potential Scenarios Will the coronavirus outbreak soon reach its peak? Image: Gavekal
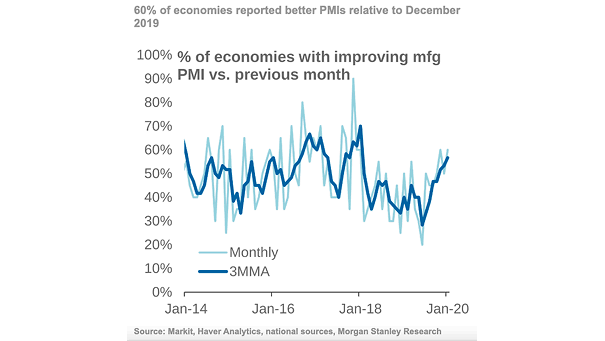
% of Economies with Improving Manufacturing PMI vs. Previous Month Global manufacturing outlook improves, as 60% of economies reported better PMIs relative to December 2019. Image: Morgan Stanley Research
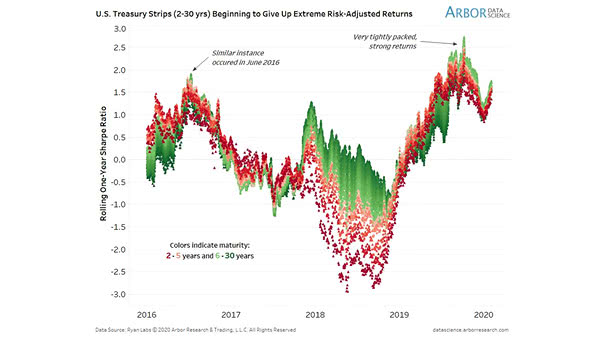
Sharpe Ratio and U.S. Treasury Strips Curve Historically, high sharpe ratios have been usually unsustainable. Image: Arbor Research & Trading LLC
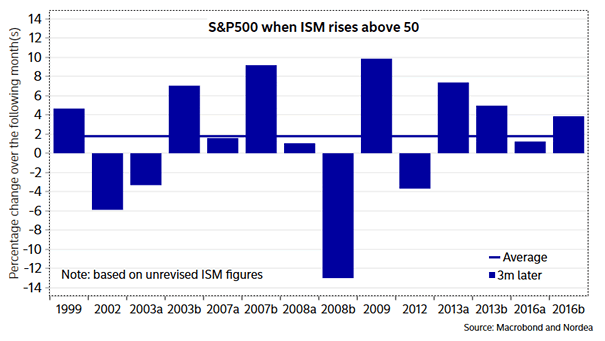
S&P 500 and ISM Manufacturing Index In recent history, when the ISM Manufacturing Index rose above 50, the S&P500 rose by about 2% on average over the next 3 months Image: Nordea and Macrobond
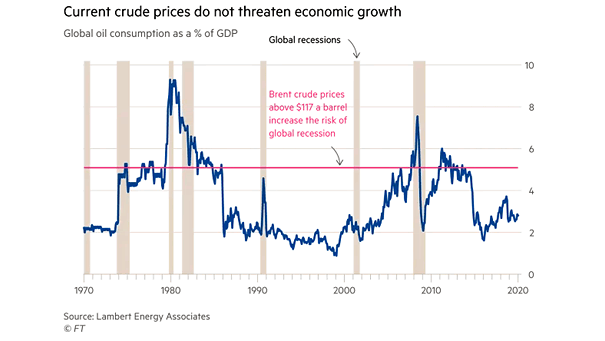
Global Oil Consumption as a % of GDP and Global Recessions Chart suggesting that Brent crude prices need to exceed US$117 to push the global economy into recession. Image: Financial Times
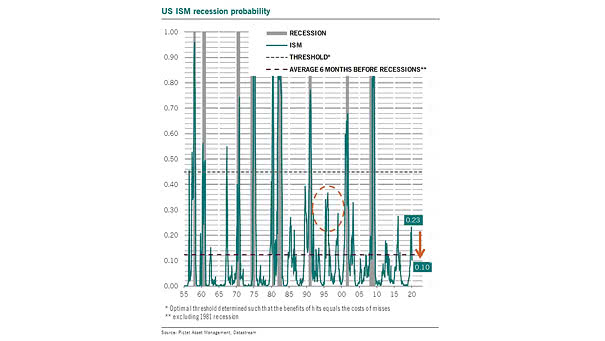
U.S. ISM Recession Probability Chart showing that historically, a level greater than 44.5% has indicated a recession. Current U.S. ISM levels suggest a recession probability of 10%. Image: Pictet Asset Management
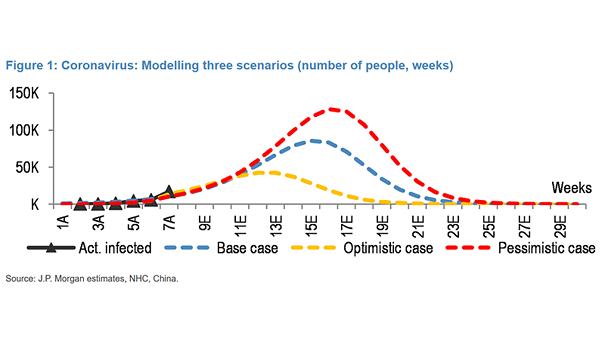
Coronavirus and Three Forecasts Optimistic case: peak of ~42k infections by the 2nd week of March Base case: peak of ~85k infections at the end of March Pessimistic case: peak of ~128k infections by the 1st week of April Image: J.P. Morgan
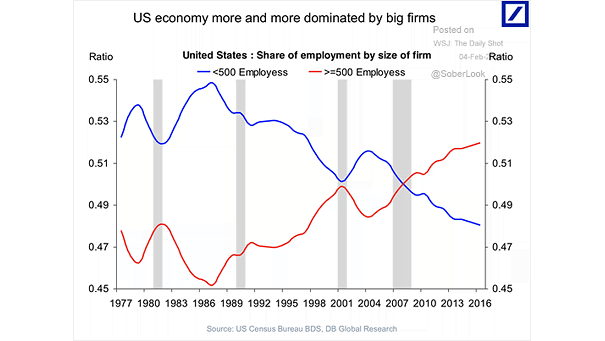
U.S. Big Companies and U.S. Job Market Big firms dominate the U.S. economy and the U.S. job market. Image: Deutsche Bank Global Research
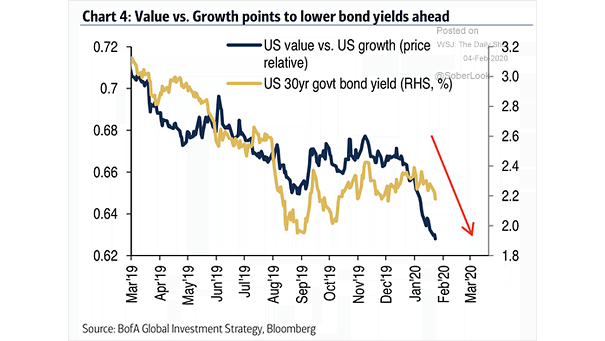
Value vs. Growth and U.S. 30-Year Government Bond Yield The outperformance of U.S. growth stocks relative to U.S. value stocks suggests lower bond yields ahead. Image: BofA Global Investment Strategy
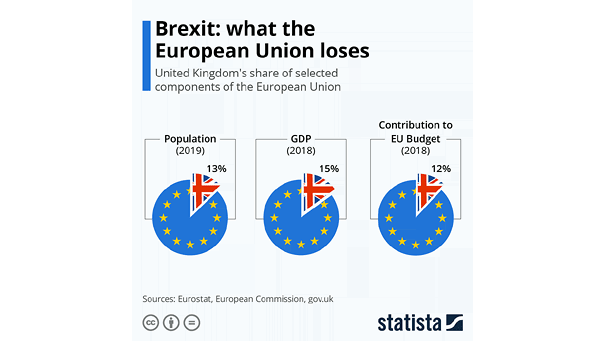
Brexit: What the European Union Loses? The chart puts into perspective what the European Union stands to lose when the Brexit transition is complete. Image: Statista
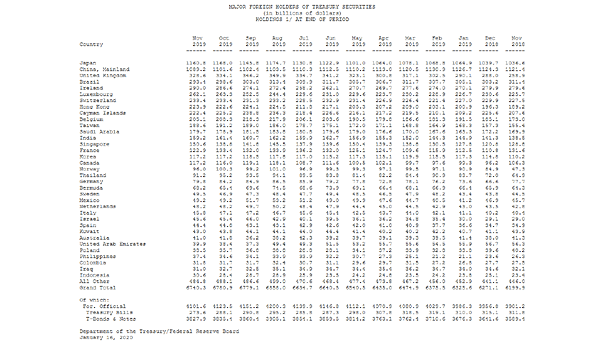
Treasury Holdings: Who Are the Major Foreign Holders of U.S. Treasury Securities? Currently, the two major foreign holders of U.S. Treasury securities are Japan and China. Japan surpasses China as largest foreign holder of U.S. Treasuries. Image: Department of the Treasury/Federal Reserve Board Click the Image to Enlarge