DM Real GDP and WTI Crude Oil (Leading Indicator)
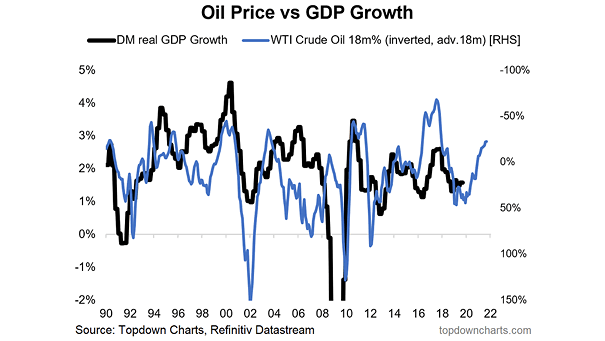
DM Real GDP and WTI Crude Oil (Leading Indicator) Chart suggesting that the 18-month rate of change of WTI crude oil (inverted) tends to lead DM real GDP by 18 months. Image: Topdown Charts
DM Real GDP and WTI Crude Oil (Leading Indicator) Chart suggesting that the 18-month rate of change of WTI crude oil (inverted) tends to lead DM real GDP by 18 months. Image: Topdown Charts
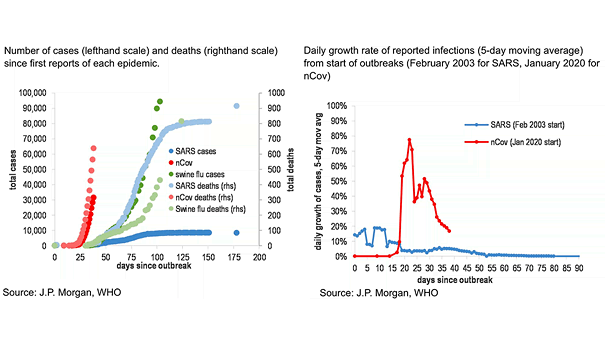
Coronavirus, SARS and Swine Flu – Number of Cases and Deaths The chart suggests that the growth rate of cases of coronavirus is slowing. Image: J.P. Morgan
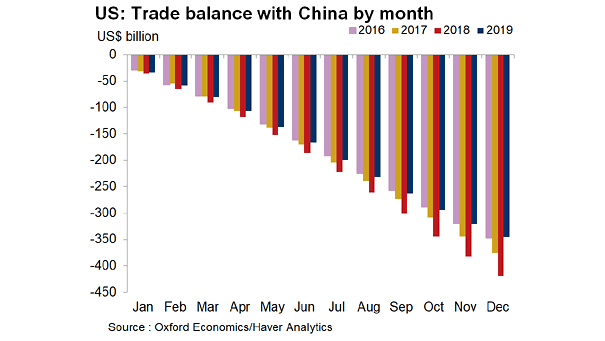
U.S. Trade Balance with China by Month U.S. deficit with China narrowed slightly in a year of trade tensions. Image: Oxford Economics
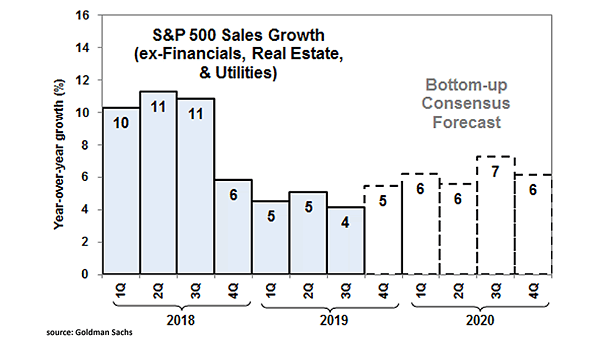
Bottom-Up Consensus Forecast of S&P 500 YoY Sales Growth Chart showing the bottom-up consensus forecast of S&P 500 year-over-year sales growth. Image: Goldman Sachs Global Investment Research
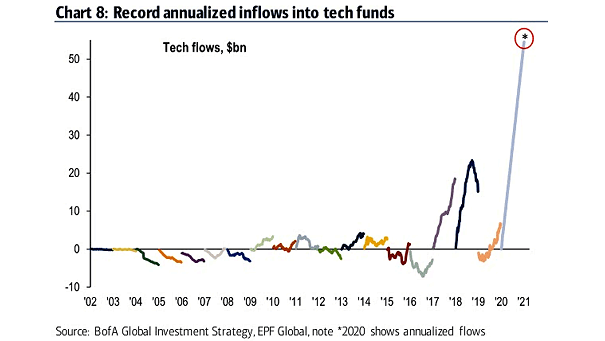
Inflows into Tech Funds This chart puts into perspective the annualized inflows into Tech funds. Image: BofA Global Investment Strategy

Valuation – Info Tech vs. S&P 500 The valuation of tech stocks relative to the S&P 500 seems relatively high. Image: Goldman Sachs Global Investment Research
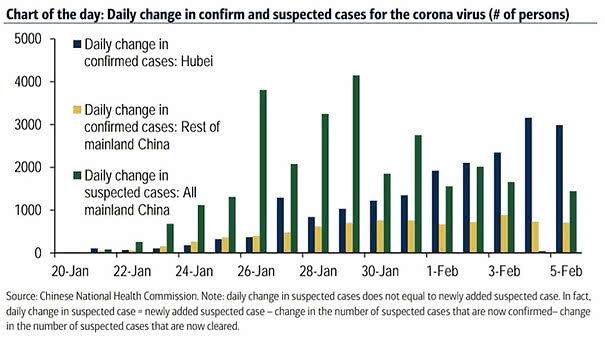
Daily Change in Confirmed and Suspected Cases for the Coronavirus The chart suggests that the number of suspected cases of coronavirus appears to be stabilizing. Image: BofA Global Research
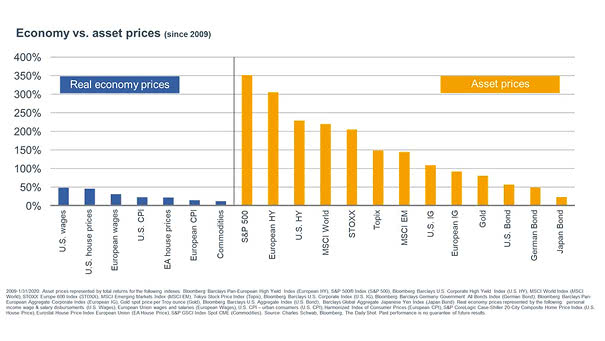
U.S. Economy vs. Asset Prices Persistent low interest rates could explain the wide divergence between real economy prices and asset prices, over the past decade. Image: Charles Schwab
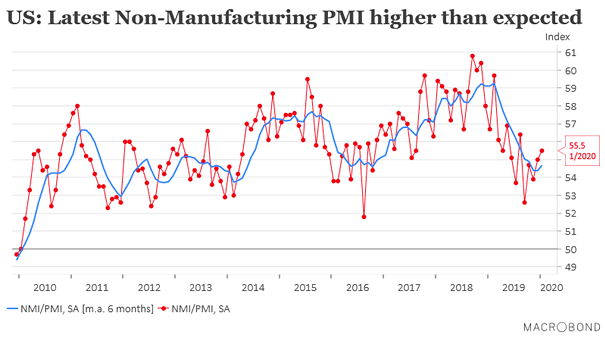
U.S. Non-Manufacturing PMI U.S. Non-Manufacturing PMI is higher than expected and continues to rebound. Image: Macrobond Financial
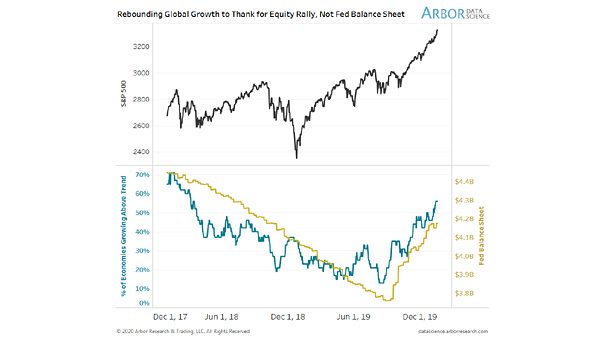
Global Growth, Equity Rally and Fed Balance Sheet This chart suggests that economic data is the driving force behind the equity rally, not the Fed’s balance sheet. Image: Arbor Research & Trading LLC
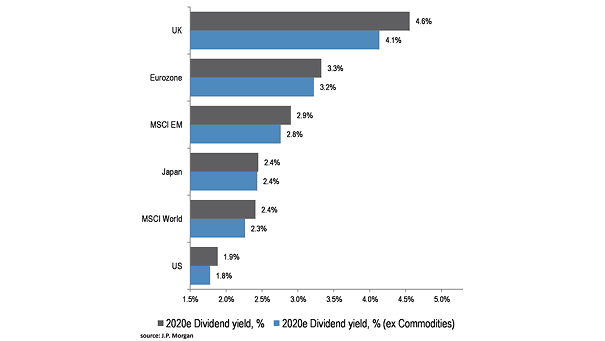
2020E Dividend Yield This chart puts 2020E dividend yields into perspective. Image: J.P. Morgan