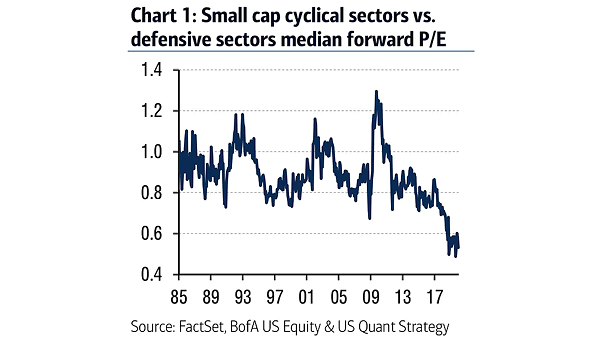
Fed Balance Sheet vs. S&P 500
Fed Balance Sheet vs. S&P 500 Chart suggesting that since October 2019, a 1% increase in the Fed balance sheet has been associated with a 0.9% increase in the S&P 500, (R² = 0.52). Image: Deutsche Bank Global Research
Business Loans at U.S. Banks Business loans at U.S. banks are tightly connected to the real economy and stalled in second half of this year. Image: Financial Times
ISM Manufacturing Index and S&P 500 Realized Volatility Interesting chart suggesting the correlation between the S&P 500 realized volatility and the ISM Manufacturing Index. Image: Goldman Sachs Global Investment Research
S&P 500 Index and Recessions Usually, the U.S. stock market isn’t this buoyant just before a recession. Image: Bloomberg
Passive Equity and Bond Funds vs. Active Equity and Bond Funds The popularity of passive investing through ETFs and index mutual funds has grown significantly since 2010. Image: Financial Times
Share of Global GDP Today, U.S. GDP contributes 23.9% of the world’s economic output. In 1960, U.S. GDP was 40% of global GDP. Image: Jeroen Blokland
World Sovereign Debt and Global Central Banks’ Holdings of Domestic Sovereign Debt Central Banks now own a high percentage of all global sovereign debt, leading to higher debt levels in coming years. Image: BofA Merrill Lynch Global Research
Quant Hedge Fund Performance vs. S&P 500 Does quant trading really work? 2019 was a tough year for quant hedge funds. Image: Bianco Research
U.S. Discretionary Spending and Recessions Because there are few imbalances, Deutsche Bank suggests that the U.S. expansion could continue for many more years. Note: discreationary spending defined as consumer durable goods, plus business capex, plus residential investment (i.e. PCE durables + gross private domestic investment). Image: Deutsche Bank Global Research
U.S. CEO Departures and S&P 500 Index It is not a good time to be a CEO. This year is on pace to have the most CEO departures on record, at rates not seen since the Great Financial Crisis. Image: Financial Times
The Most Valuable Companies by Market Capitalization This nice visualization puts into perspective the most valuable companies of all time. Image: howmuch.net