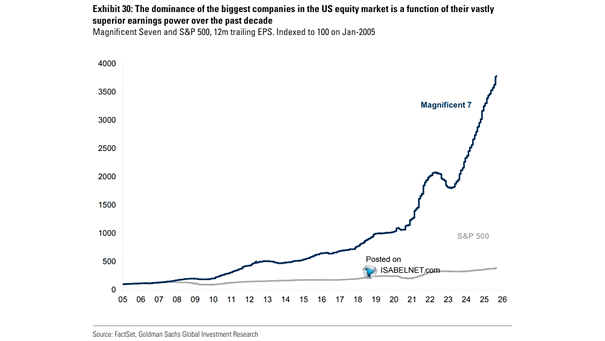
Magnificent Seven and S&P 500 – 12-Month Trailing EPS
Magnificent Seven and S&P 500 – 12-Month Trailing EPS The strong earnings power and consistent profit growth of the largest U.S. companies have been key factors in maintaining their dominant positions in the U.S. equity market over the past decade. Image: Goldman Sachs Global Investment Research