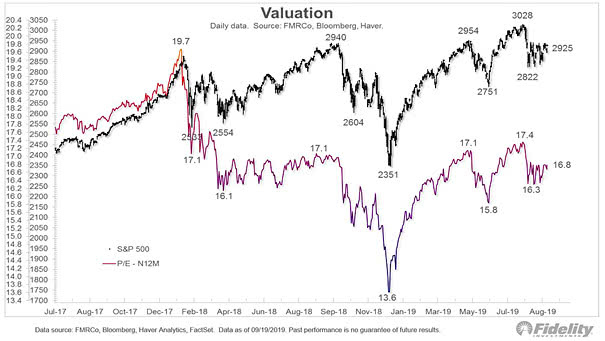
Valuation – S&P 500 Real Value Index
Valuation – S&P 500 Real Value Index Since 1871, the S&P 500 real total returns, dividends reinvested, have averaged 6.9% a year. The U.S. Real Value Index has always mean-reverted — and right now, it is between 10% and 20% above fair value. Image: TS Lombard