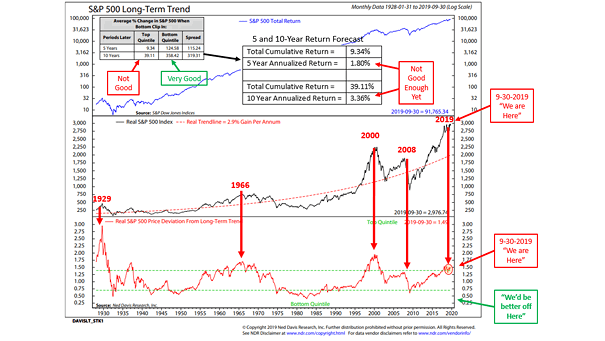
S&P 500 Index – Trend Channel
S&P 500 Index – Trend Channel After a long, uninterrupted climb since 2009, the S&P 500’s secular bull market looks mature, with the long-term trend channel suggesting growing risks beneath the surface momentum. Image: Ned Davis Research