QE in 2020 and Central Banks (the Fed, ECB and BoJ)
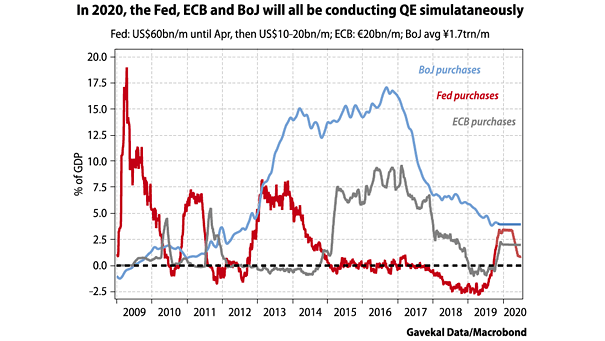
QE in 2020 and Central Banks (the Fed, ECB and BoJ) Central banks’ QE should support financial markets next year. Image: Gavekal, Macrobond
QE in 2020 and Central Banks (the Fed, ECB and BoJ) Central banks’ QE should support financial markets next year. Image: Gavekal, Macrobond
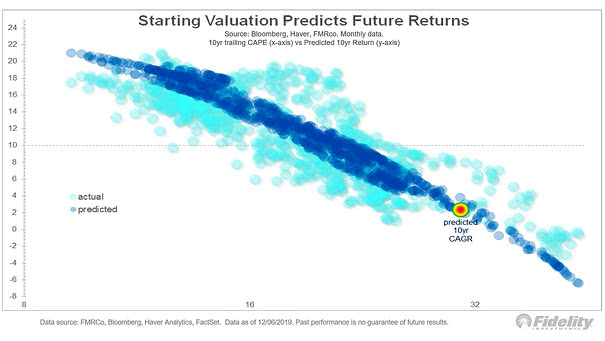
Starting Valuation Predicts Future Returns Based on the Shiller CAPE ratio, the chart suggests a 10-year compound annual growth rate of only 2% to 4% for the U.S. stock market. Image: Fidelity Investments
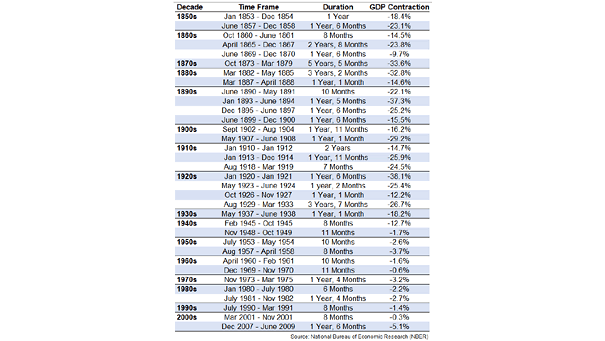
U.S. Recessions – NBER Since 1850, this will be the first decade without a recession in the United States. Image: National Bureau of Economic Research
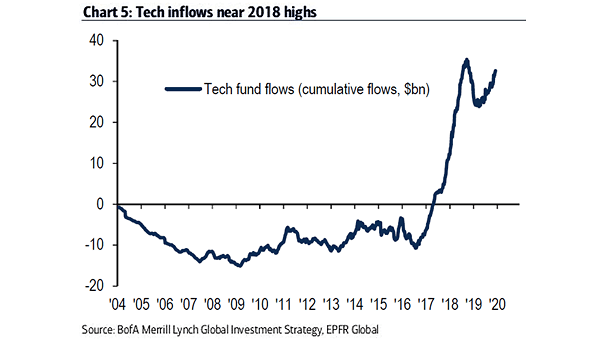
Tech Fund Flows Are tech fund inflows indicating a potential bubble? Image: BofA Merrill Lynch Global Investment Strategy
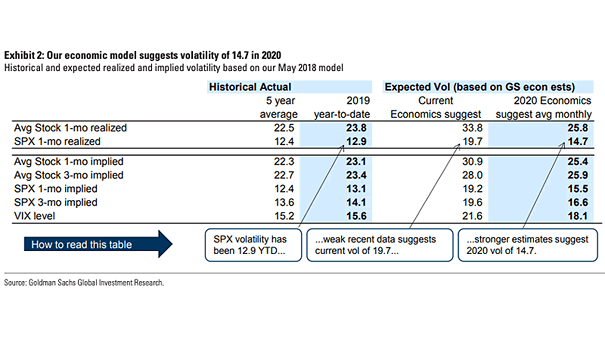
S&P 500 Volatility in 2020 Goldman Sachs economic model suggests volatility of 14.7 on average next year. Image: Goldman Sachs Global Investment Research
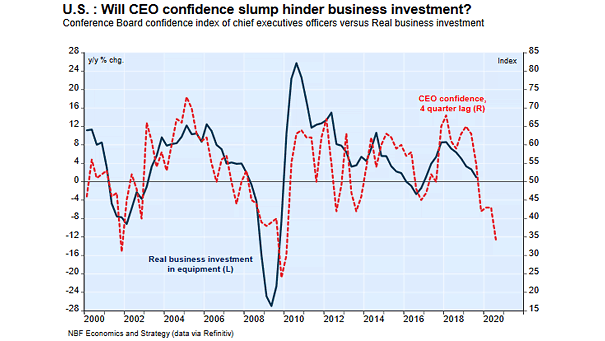
Conference Board Confidence Index of CEO vs. U.S. Real Business Investment The trade war has no winners and could curtail U.S. business investment further. Image: NBF Economics and Strategy
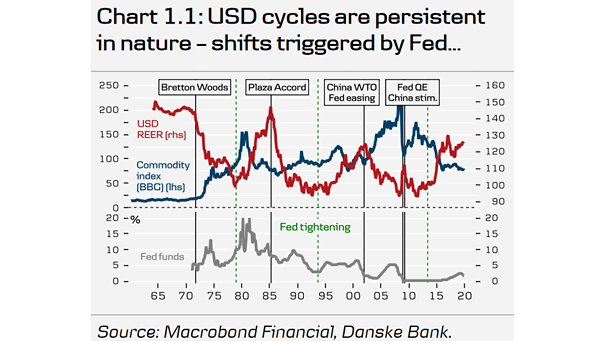
U.S. Dollar Cycles U.S. dollar cycles are persistent and are counted in years. In the absence of a recession in the U.S. in 2020, the strength of the U.S. dollar should continue for some time. Image: Danske Bank
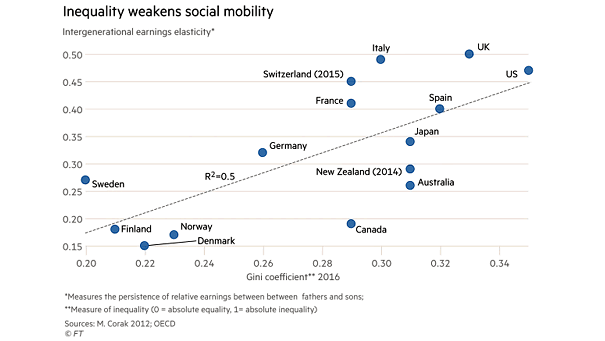
Inequality – Intergenerational Earnings Elasticity and Gini Coefficient Chart suggesting that social mobility cannot be achieved without greater equality (R² = 0.5) Image: Financial Times
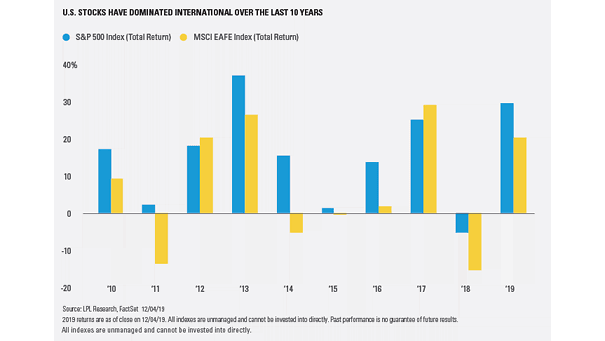
S&P 500 Index vs. MSCI EAFE Index Largely due to structural headwinds, international stocks have underperformed U.S. stocks significantly in this bull market, over the last ten years. It could continue next year as well. Image: LPL Research
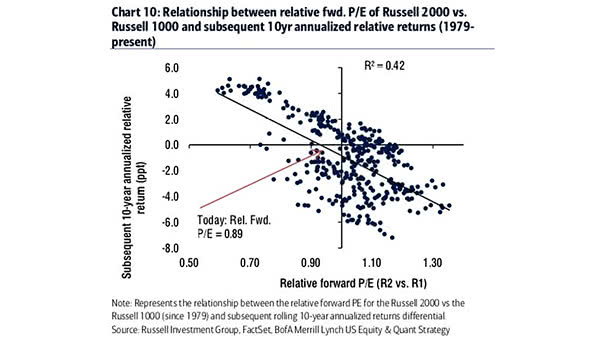
Russell 2000 vs. Russell 1000 and Subsequent 10-Year Annualized Relative Returns Chart suggesting that small caps should outperform large caps over the next 10 years (R² = 0.42). Image: BofA Merrill Lynch US Equity & US Quant Strategy
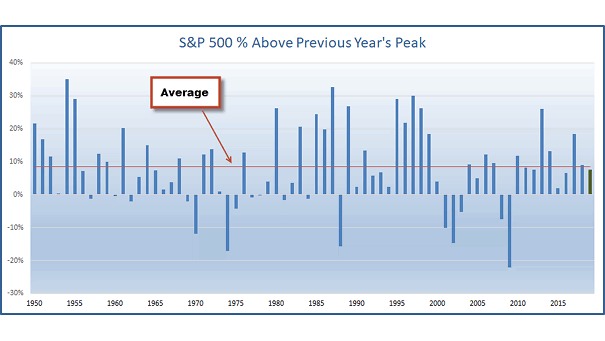
S&P 500 % Above Previous Year’s Peak Is this a blow-off top? The S&P 500 is only 7.6% above the peak from 2018, and below the average of 8.5%. Image: Ryan Detrick, LPL Financial LLC