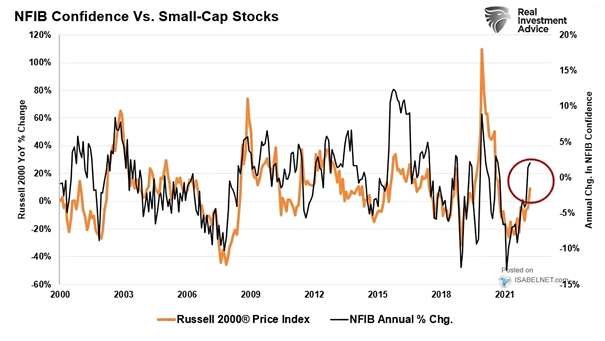
NFIB Confidence vs. U.S. Small-Cap Stocks
NFIB Confidence vs. U.S. Small-Cap Stocks The NFIB Small Business Survey’s annual rate of change closely mirrors U.S. small-cap stock performance, making the NFIB index a key economic indicator for investors in this market segment. Image: Real Investment Advice