Inflation, Hard Data and Soft Data
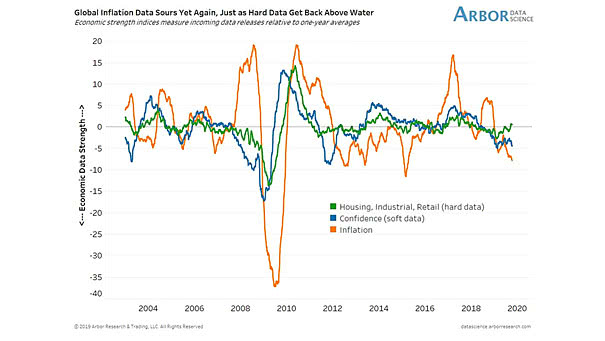
Inflation, Hard Data and Soft Data Hard data are back above long-run averages. But the chart clearly shows the divergence between hard data and soft data. Image: Arbor Research & Trading LLC
Inflation, Hard Data and Soft Data Hard data are back above long-run averages. But the chart clearly shows the divergence between hard data and soft data. Image: Arbor Research & Trading LLC
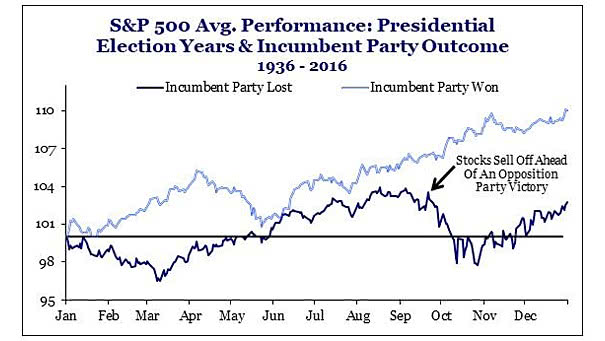
S&P 500 Average Performance – Presidential Election Years and Incumbent Party Outcome The S&P 500 performance 90 days before the U.S. Presidential election is very accurate in predicting the election winner. If the S&P 500 is up in the 90 days leading to election day, the incumbent party usually wins. This is true for 90%…
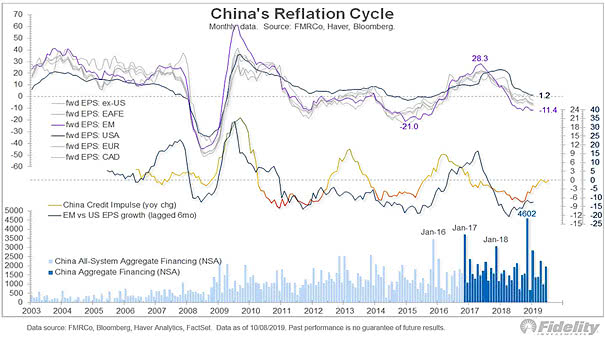
China Credit Impulse – Reflation Cycle This chart shows that China credit impulse has not yet boosted relative earnings. Credit impulse is the change in new credit issued as a percentage of GDP. Image: Fidelity Investments
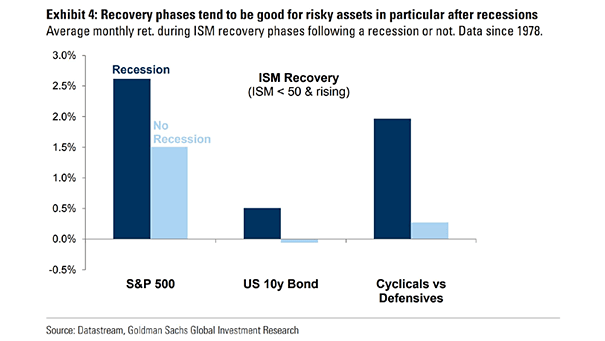
U.S. ISM Recovery and Returns: Recession vs. No Recession After a recession, U.S. equities tend to perform well during ISM recoveries. Image: Goldman Sachs Global Investment Research
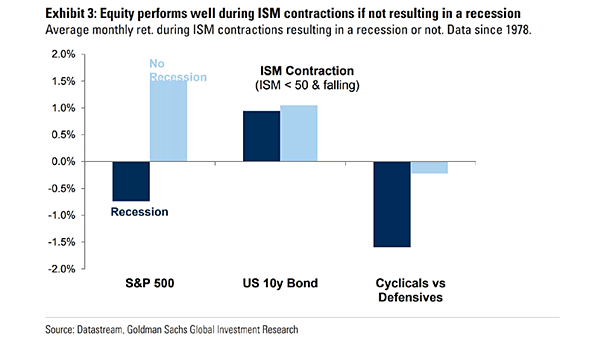
U.S. ISM Contraction and Returns: Recession vs. No Recession If there is no recession, U.S. equities tend to perform well during ISM contractions. Image: Goldman Sachs Global Investment Research
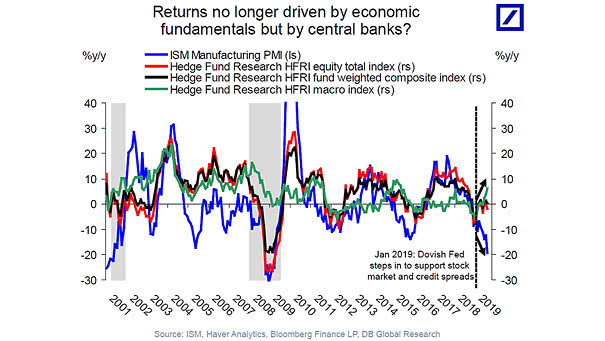
Returns Driven by Central Banks? This chart suggests that equity and credit markets are no longer driven by fundamentals, at the moment. Image: Deutsche Bank Global Research
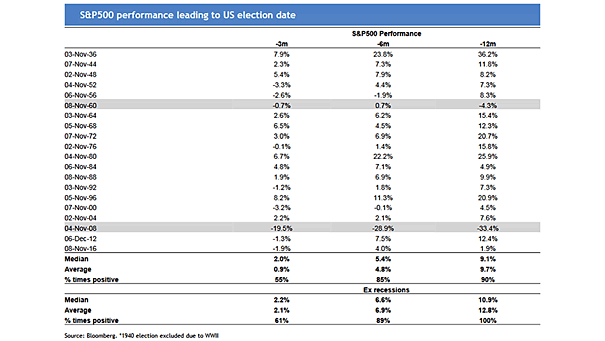
S&P 500 Performance Leading to U.S. Election Date This table shows that over the last 20 election cycles in the U.S., there have been only two instances of market declines in the 12 months leading to the election results. Image: J.P. Morgan Asset Management
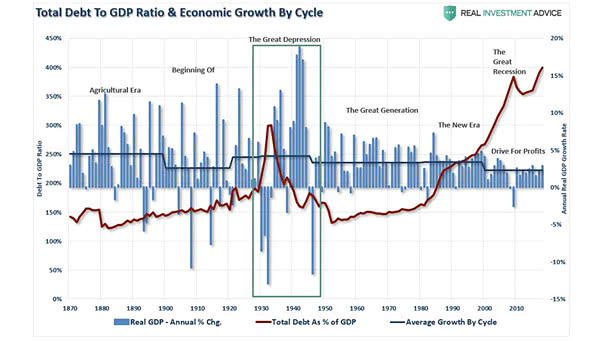
U.S. Total Debt to GDP Ratio and Economic Growth by Cycle This nice chart clearly shows that U.S. GDP is weaker today than in the past, despite higher debt levels. Image: Real Investment Advice
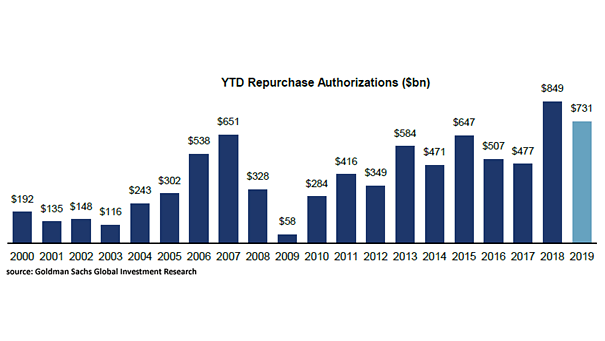
U.S. Repurchase Authorizations (Buybacks) U.S. repurchase authorizations are bigger than ever. Image: Goldman Sachs Global Investment Research
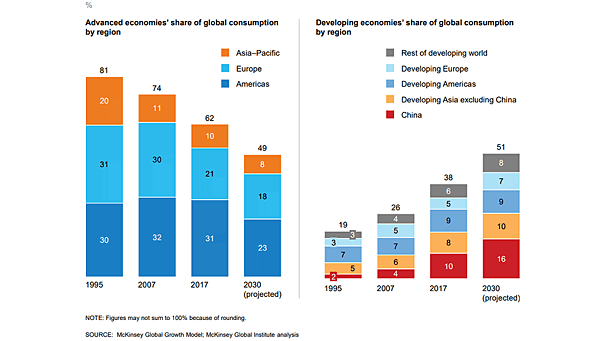
Global Consumption by Region Chart suggesting that developing economies will dominate global consumption. Image: McKinsey Global Institute
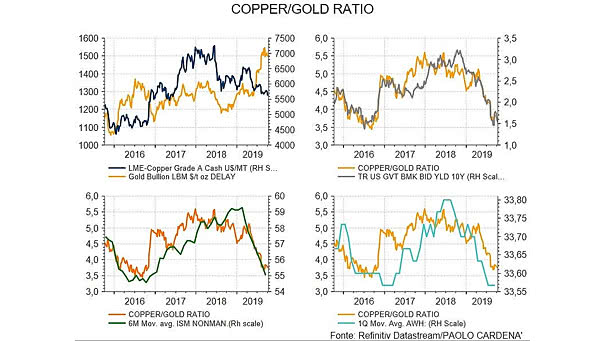
Copper to Gold Ratio The copper to gold ratio provides useful information on the evolution of the U.S. 10-year Treasury, the ISM Non-Manufacturing Index and the average weekly hours worked. Image: Paolo Cardena