U.S. and Eurozone Unemployment Rates
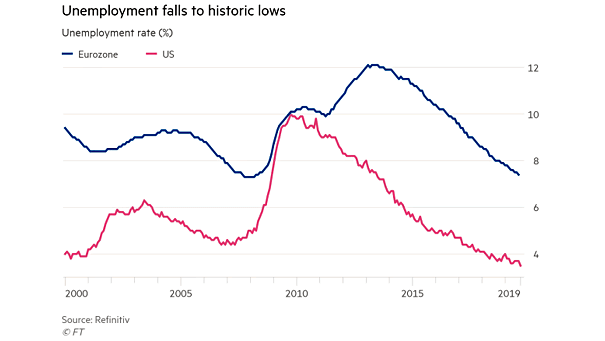
U.S. and Eurozone Unemployment Rates This chart shows the gap between the unemployment rates of the two economies, while unemployment falls to historic lows. Image: Financial Times
U.S. and Eurozone Unemployment Rates This chart shows the gap between the unemployment rates of the two economies, while unemployment falls to historic lows. Image: Financial Times
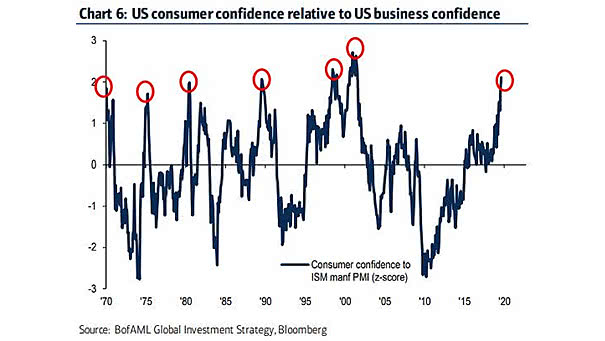
U.S. Consumer Confidence Relative to U.S. Business Confidence This chart shows one of the highest divergence between consumer confidence and business confidence, more than two standard deviations. Image: BofA Merrill Lynch
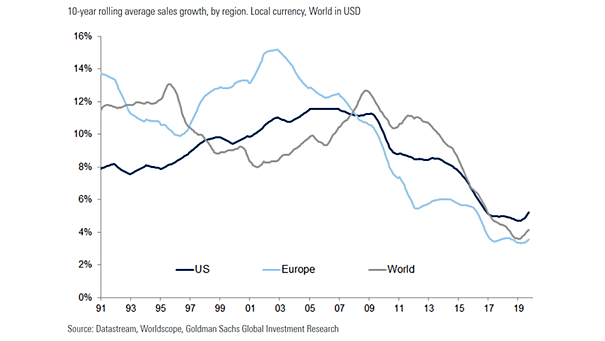
10-Year Rolling Average Sales Growth by Region The importance of remembering the past: this chart shows the steep decline in sales growth over time. Image: Goldman Sachs Global Investment Research
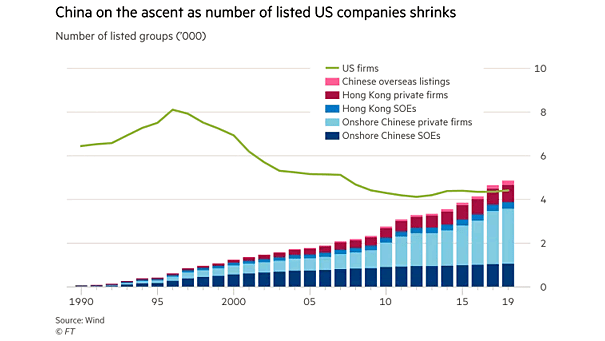
U.S. vs. China – Number of Listed Companies, IPO There are fewer firms listed on U.S. exchanges than 20 years ago. And the U.S. has also fewer listed public companies than China. Image: Financial Times
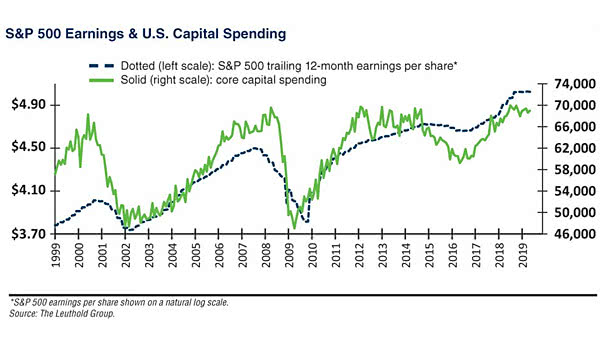
S&P 500 Earnings and U.S. Capital Spending This chart shows that U.S. core capital spending is near a 20-year high. Are fears that U.S. companies may be curtailing spending plans overblown? The absence of dividend cuts also suggests that U.S. companies are confident in their future earnings potential. Image: The Leuthold Group
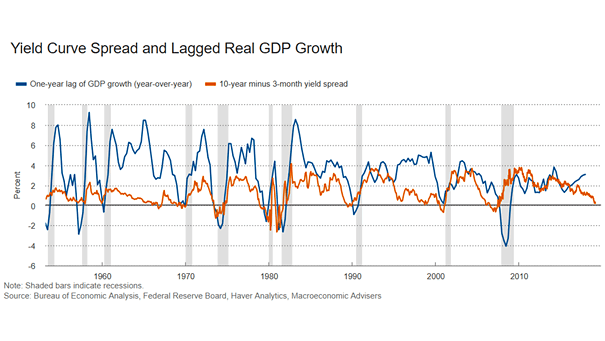
10Y-3M Yield Curve Spread Leads U.S. Real GDP Growth This chart suggests that the 10Y-3M yield spread leads U.S. real GDP growth by one year. So, what about real GDP growth in 2020?
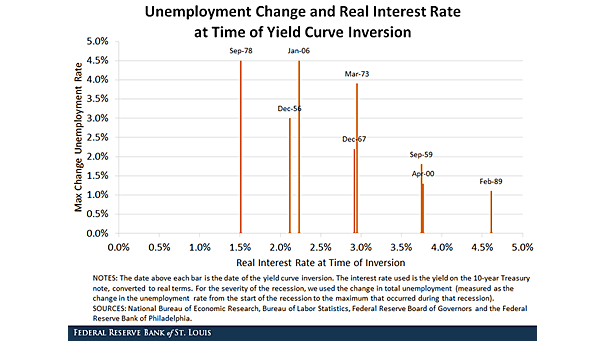
U.S. Unemployment Change and Real Interest Rate at Time of Yield Curve Inversion Looking at real interest rates can provide some insight about the severity of a recession before it starts. This chart suggests that unemployment could increase significantly during the next recession.
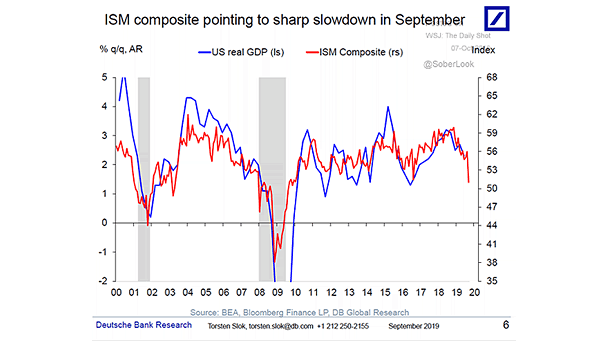
U.S. ISM Composite Index and U.S. Real GDP This chart shows the good correlation between the ISM Composite Index (services + manufacturing) and U.S. real GDP. What about U.S. GDP growth in 2020? Image: Deutsche Bank Global Research
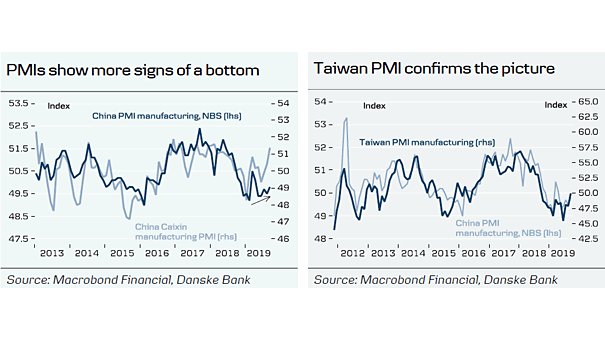
China and Taiwan Manufacturing PMI The charts suggest a bottom in the Chinese and Taiwanese cycle in early 2020. Historically, this has been positive for global equities. Image: Danske Bank Research
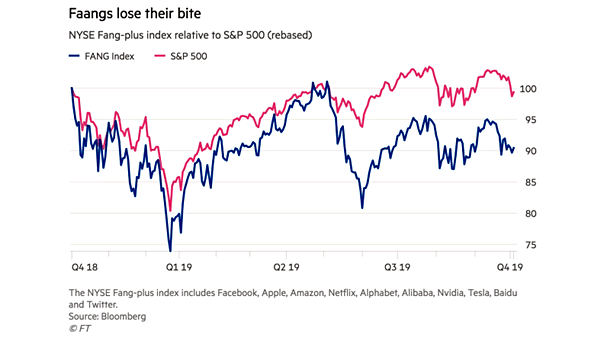
FAANG Stocks vs. S&P 500 Investors opt for safer stocks rather than FAANG stocks. Image: Financial Times
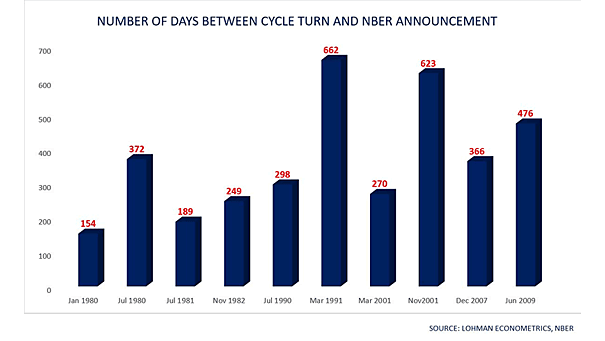
Number of Days Between Cycle Turn and NBER Announcement The current U.S. business cycle is the longest on record. But what about the number of days between the cycle turn and the NBER announcement? Image: Lohman Econometrics