S&P 500 Various Declines per Year
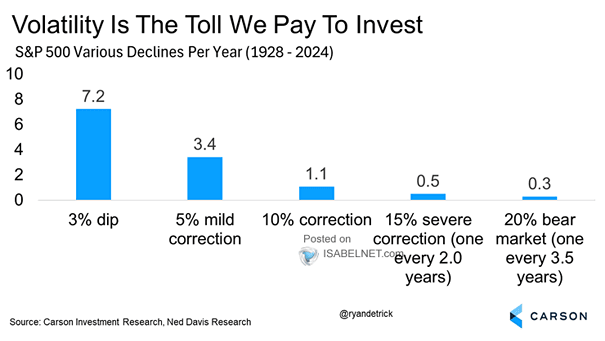
S&P 500 Various Declines per Year Volatility is part of the market’s DNA; the real skill lies in how investors navigate the bumps to keep compounding. Image: Carson Investment Research
S&P 500 Various Declines per Year Volatility is part of the market’s DNA; the real skill lies in how investors navigate the bumps to keep compounding. Image: Carson Investment Research
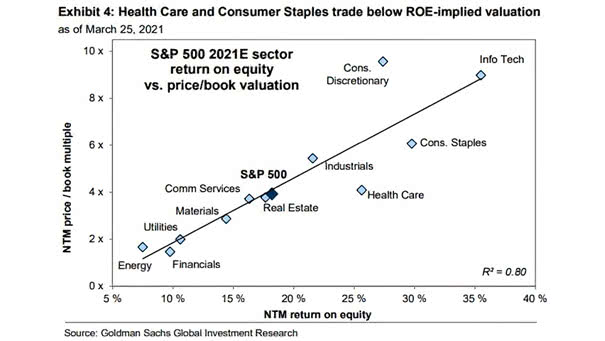
U.S. vs. Non-U.S. Equities Valuations vs. ROE Investors aren’t shy about paying a premium for U.S. stocks. The payoff? Superior returns on equity and earnings growth that few markets can match. Image: Goldman Sachs Global Investment Research
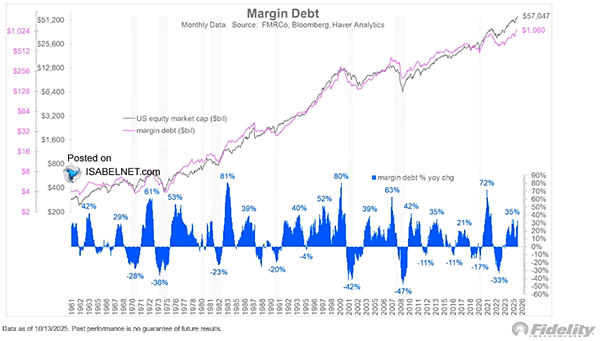
S&P 500 and Margin Debt Now above $1 trillion, margin debt stands at just about 1/57th of the total U.S. equity market cap, up 35% from a year ago—still a far cry from the surges seen at past bubble highs. Market tone feels alert, not alarmed. Image: Fidelity Investments
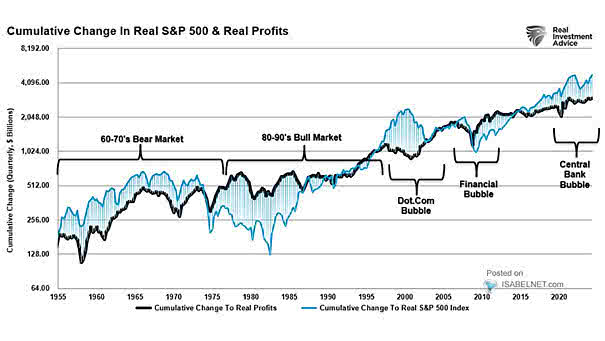
Cumulative Change in Real S&P 500 and Real Profits Earnings remain solid, especially in tech, but the widening gap between the real S&P 500 index and real corporate profit growth suggests investors may be chasing momentum more than fundamentals. Image: Real Investment Advice
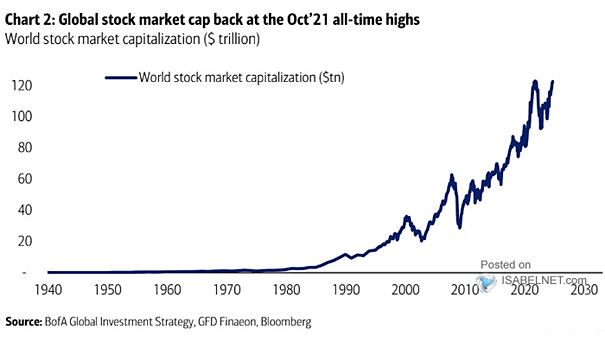
Market Capitalization – United States vs. Asia vs. Europe Wall Street has smoked global rivals on roaring earnings, fat margins, and deep capital. But, sky-high prices and overheated expectations could break its stride. Image: Goldman Sachs Global Investment Research
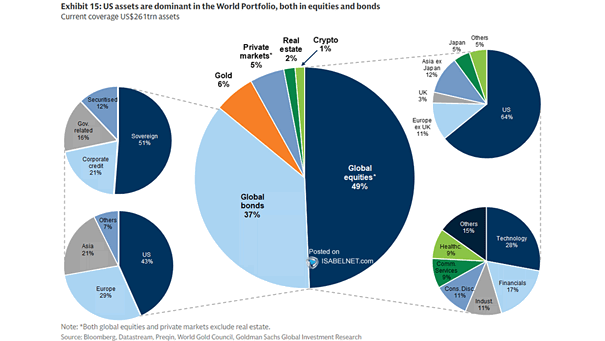
World Portfolio The world’s portfolio remains tilted toward the U.S.—in both stocks and bonds. Gold holds a modest 6%, while crypto barely cracks 1%. Image: Goldman Sachs Global Investment Research

Valuation – S&P 500 Median P/E Ratio The S&P 500’s median P/E ratio sits at 26.2—a level that leaves stocks looking pricey and raises the odds of thinner returns or a valuation pullback if history is any guide. Image: Ned Davis Research
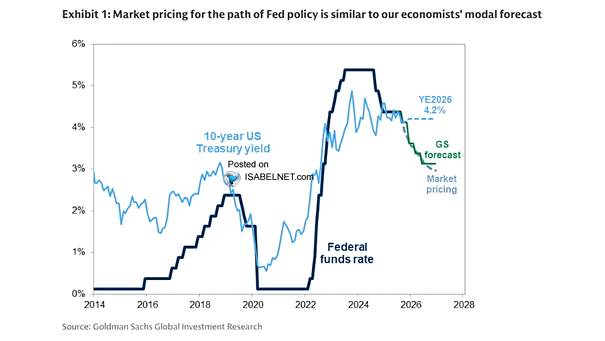
Fed Funds Rate and 10-Year U.S. Treasury Yield The S&P 500’s record-breaking rally shows no signs of cooling, with market participants now positioning for another Fed rate cut on October 29 to fuel the next leg higher. Image: Goldman Sachs Global Investment Research
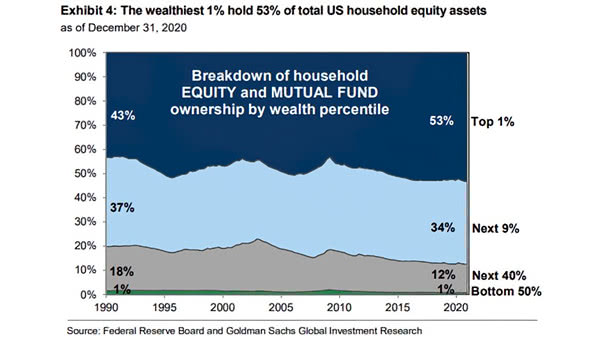
U.S. Household Equity Ownership by Wealth Percentile Call it the American Dream or a widening divide. The top 1% now hold about half of U.S. market wealth. The bottom half? Just 1%. The gap has been widening since 1990, and frustration is rising with it. Image: Goldman Sachs Global Investment Research
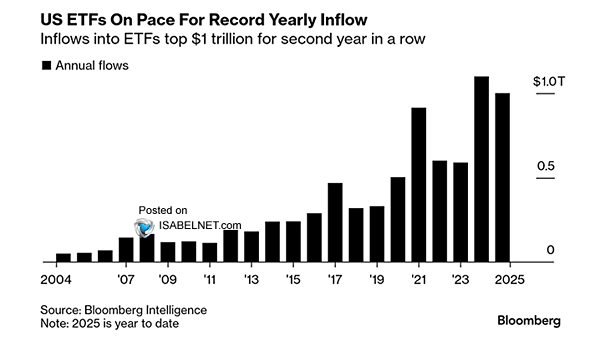
U.S. ETF Flows Cash is flooding into U.S. ETFs—over $1 trillion so far in 2025—a record-breaking surge running more than three times the usual seasonal pace as investors chase diversification and tactical flexibility. Image: Bloomberg
Gold 6-Month Rolling Return Gold just clocked one of its largest 6-month rallies. ETF inflows are surging, physical demand refuses to cool, and the move looks more structural than speculative. Image: Goldman Sachs Global Investment Research