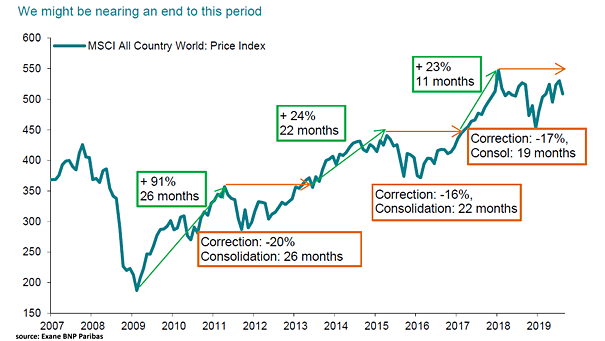
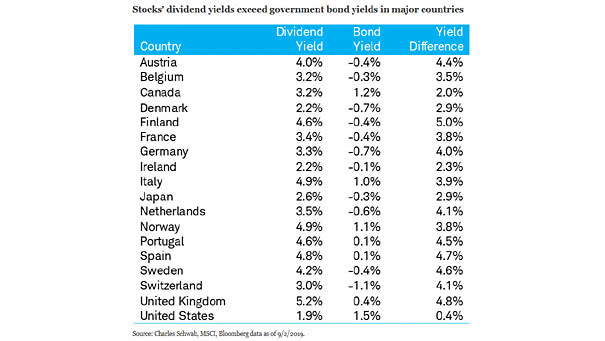
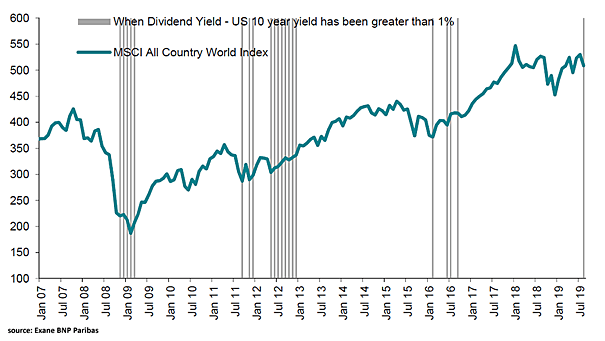
Global Bond Fund Flows

Global Bond Fund Flows Over the past 3 months, investors have injected $160bn into bond funds, fearing a global recession. Image: BofA Merrill Lynch

Allocation to Cash and Recession Probability

Allocation to Cash and Recession Probability This chart shows the correlation between allocation to cash and the NY Fed 12-month ahead recession probability indicator. Image: Barclays Research

S&P 500 Median Stock Net Leverage

S&P 500 Median Stock Net Leverage Net leverage of the median S&P 500 companies reached new highs, above 1.8. Image: Goldman Sachs Global Investment Research

Overtime Hours Lead U.S. Nonfarm Payrolls

Overtime Hours Lead U.S. Nonfarm Payrolls Great chart suggesting that overtime hours lead U.S. nonfarm payrolls by 3 months (R = 0.90). Image: Paolo Cardena

Crypto Market Capitalization Percentages

Crypto Market Capitalization Percentages Bitcoin dominance is clearly on the rise and is now 69% of all cryptocurrency market capitalization. Image: CoinMarketCap

CS Global Risk Appetite Index

CS Global Risk Appetite Index The Credit Suisse Global Risk Appetite Index falls, but is not at panic level. Image: Credit Suisse

U.S. Productivity Growth and Hourly Compensation

U.S. Productivity Growth and Hourly Compensation When wages lag behind productivity growth, workers do not receive their fair share of the wealth created. Image: Economic Policy Institute