U.S. Retail Sales and Consumer Sentiment
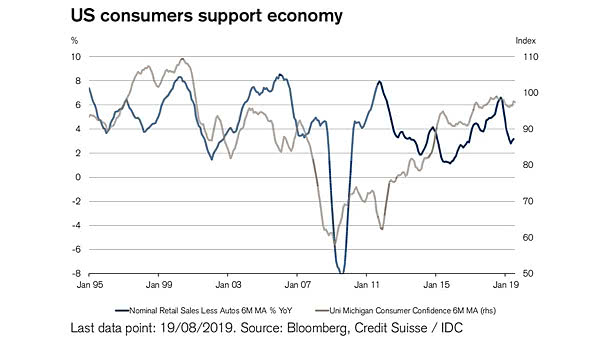
U.S. Retail Sales and Consumer Sentiment Currently, the consumer is doing well, keeping the U.S. economy from tanking, and consumer sentiment is high. Image: Credit Suisse
U.S. Retail Sales and Consumer Sentiment Currently, the consumer is doing well, keeping the U.S. economy from tanking, and consumer sentiment is high. Image: Credit Suisse
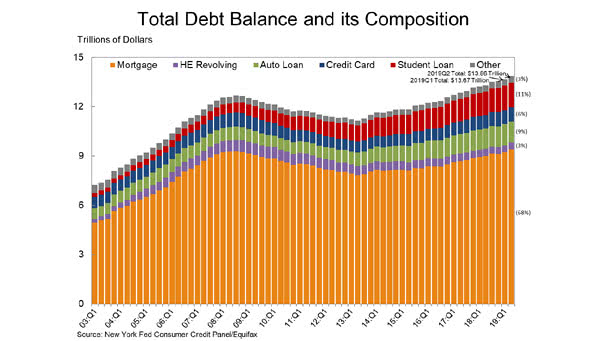
Total U.S. Household Debt Balance and Its Composition Total U.S. household debt increased by $192 billion (1.4%) to $13.86 trillion in Q2 2019. Image: New York Fed Consumer Credit Panel
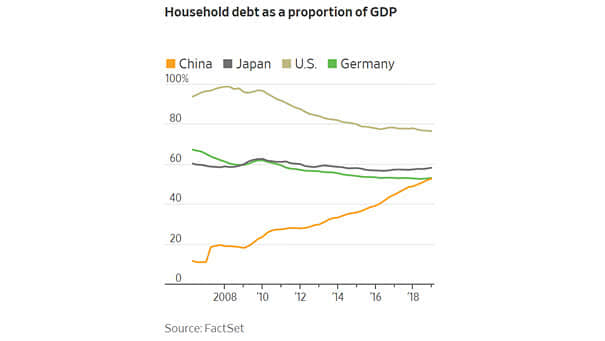
Household Debt as a Proportion of GDP Household debt levels in China are equivalent to those in advanced economies. Image: The Wall Street Journal
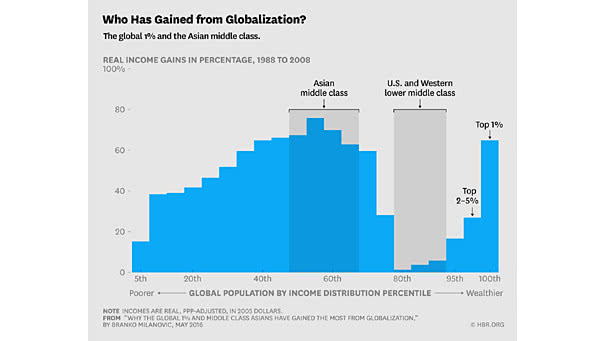
Who Has Gained From Globalization? The Asian middle class and the global 1% have gained the most from globalization. Image: Harvard Business Publishing
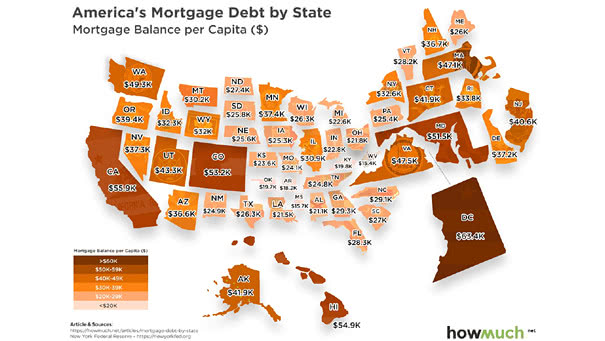
America’s Mortgage Debt by State The average mortgage debt per capita in the United States is $33.680. Image: howmuch.net
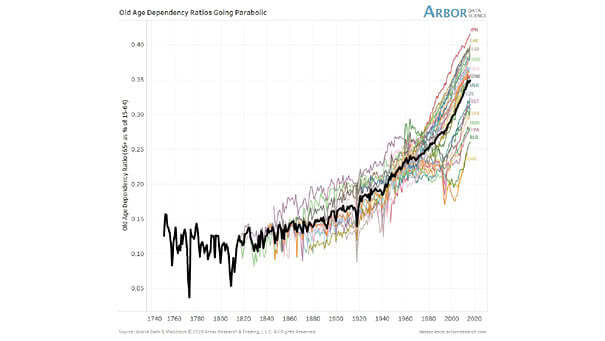
Demographics – Old Age Dependency Ratio The world’s population is ageing and demographics explain low interest rates. Image: Arbor Research & Trading LLC
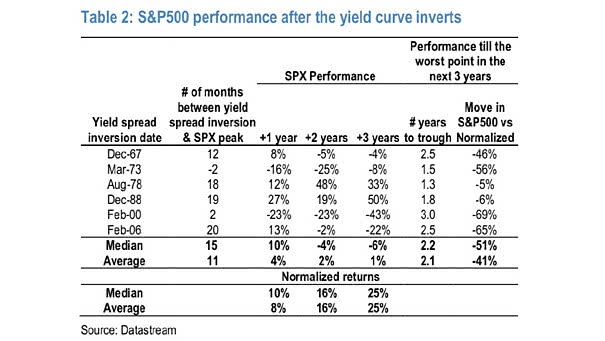
S&P 500 Performance and Yield Curve Inversions Past yield curve inversions preceded top in SPX by about 11 months. Image: J.P. Morgan
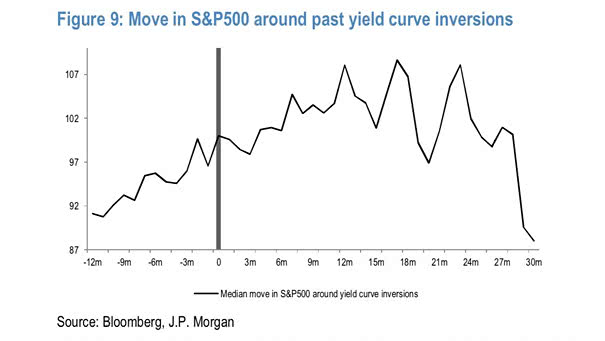
S&P 500 Around Past Yield Curve Inversions Another interesting chart from J.P. Morgan showing the median move in the S&P 500 around past yield curve inversions and the market peak. Image: J.P. Morgan
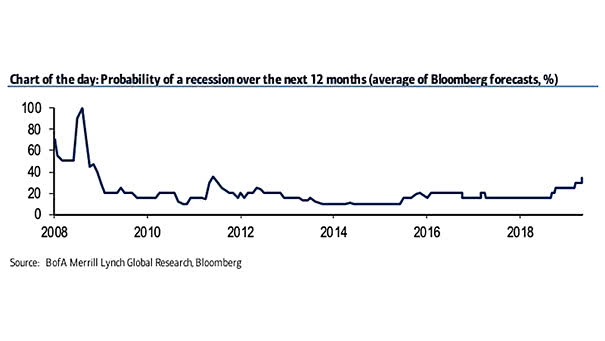
Probability of A Recession Over the Next 12 Months The Bloomberg survey of professional forecasters shows a 35% probability of a recession over the next 12 months Image: BofA Merrill Lynch
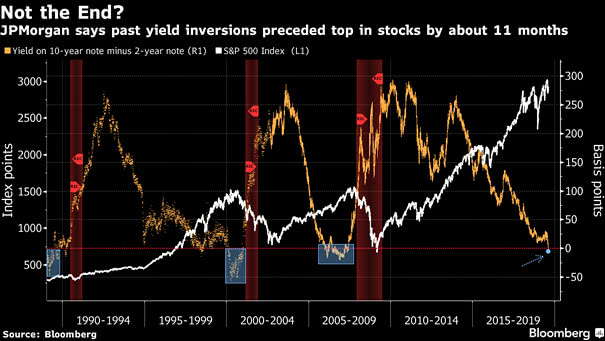
Past Yield Curve Inversions Preceded Top in Stocks by About 11 Months In the 12 months following an inversion of the yield curve, the S&P 500 return averaged about 10%. Image: Bloomberg
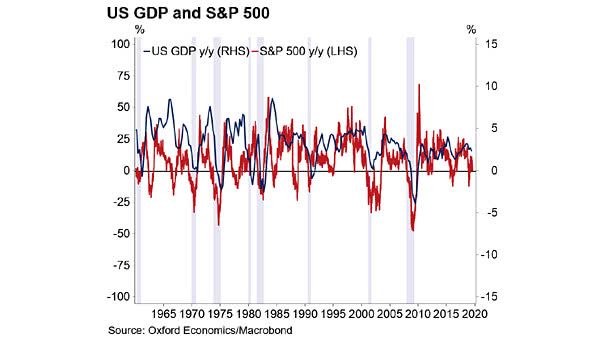
U.S. GDP and S&P 500 This interesting chart puts market corrections and U.S. GDP in perspective. Image: Oxford Economics, Macrobond