ISM Non-Manufacturing Index vs. U.S. GDP
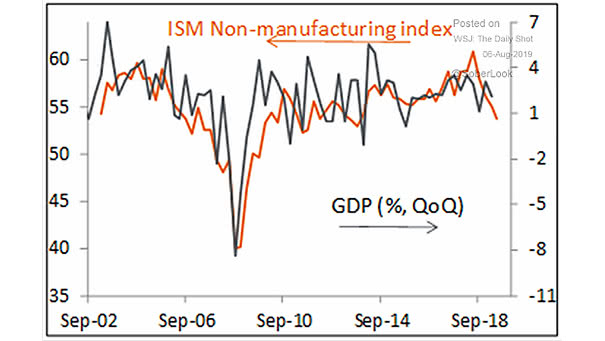
ISM Non-Manufacturing Index vs. U.S. GDP The chart shows the good correlation between ISM Non-Manufacturing PMI and U.S. GDP. Image: Piper Jaffray
ISM Non-Manufacturing Index vs. U.S. GDP The chart shows the good correlation between ISM Non-Manufacturing PMI and U.S. GDP. Image: Piper Jaffray
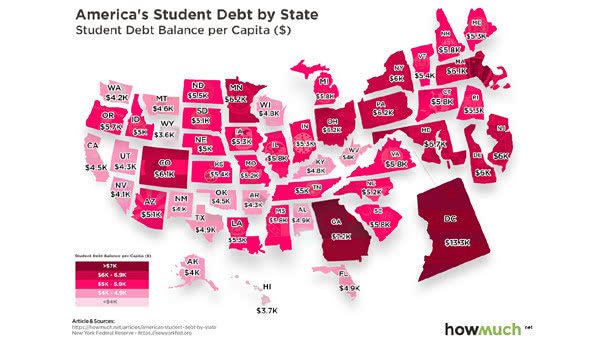
America’s Student Debt by State Student loan debt has more than tripled over the last decade to $1.5 trillion. You may also like “Distribution of Student Loan Borrowers by Balance.” Image: howmuch.net
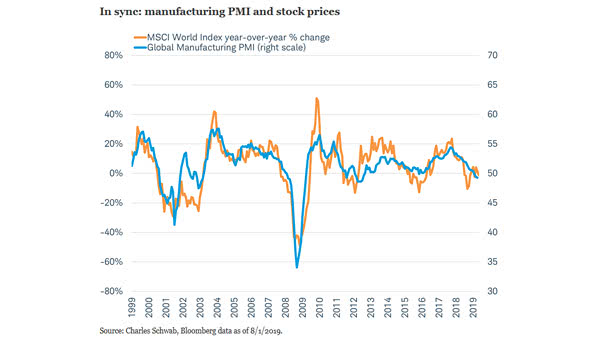
Global Manufacturing PMI and MSCI World Index The chart shows a pretty good correlation between Global Manufacturing PMI and the MSCI World Index. Stocks and PMI tend to move together. Image: Charles Schwab
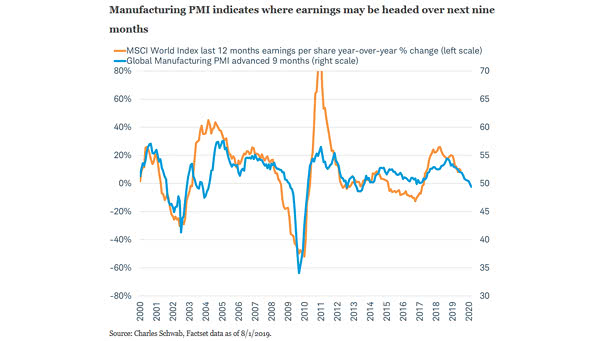
Global Manufacturing PMI Leads Earnings The chart suggests that Global Manufacturing PMI leads earnings by 9 months. Image: Charles Schwab
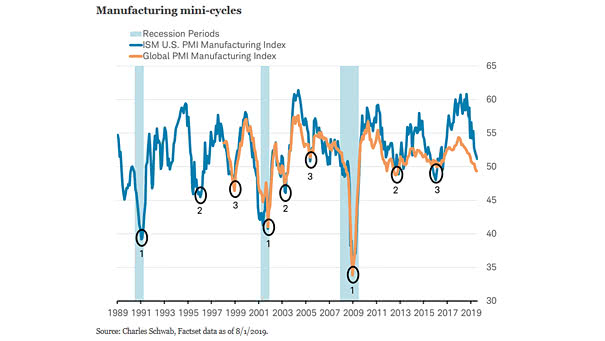
ISM Manufacturing Index – Mini-Cycles and Recessions During the economic cycle, the last mini-cycle usually leads to a recession. Image: Charles Schwab
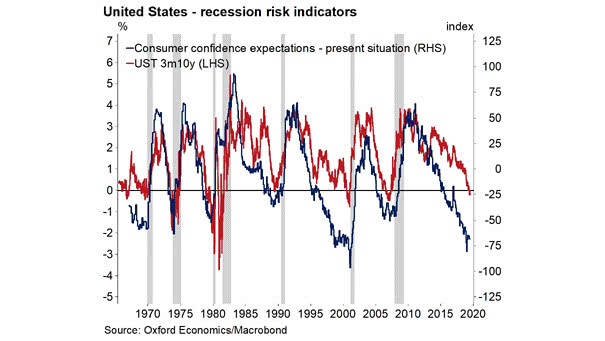
U.S. Recession Risk Indicators An inverted yield curve and gloomy confidence expectations generally do not bode well. Image: Oxford Economics, Macrobond
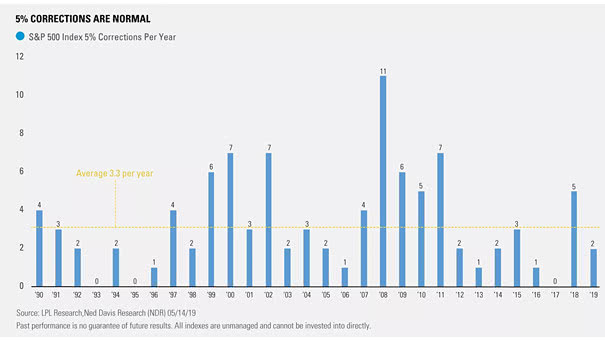
S&P 500 5% Pullbacks per Year Since 1990, the average number of 5% pullbacks in the S&P 500 Index per year is 3.3. Currently, 2019 has two pullbacks of 5%. Image: LPL Research
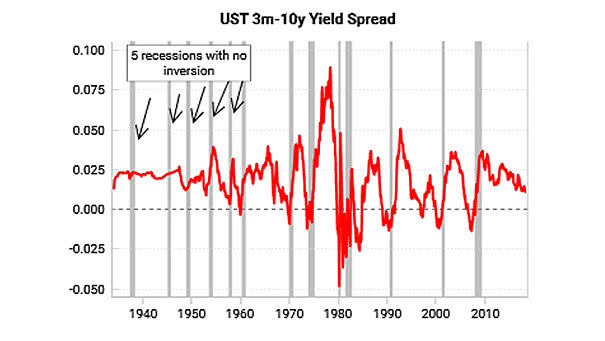
U.S. Recession With No Yield Curve Inversion Before 1960, five recessions occurred with no yield curve inversion. The yield curve is one recession indicator among many others. Image: Variant Perception Research
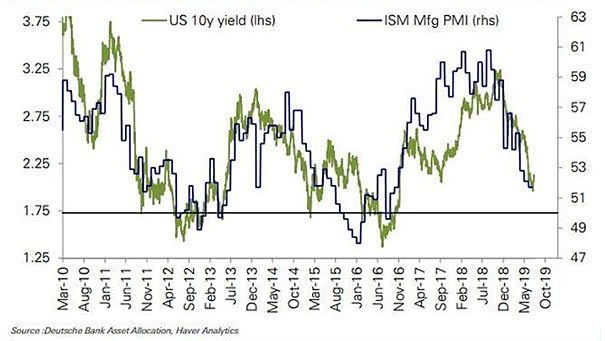
ISM Manufacturing Index and U.S. 10-Year Treasury Bond Yield The decline in U.S. 10-year Treasury bond yields has been in line with falling ISM PMI. Picture Source: Deutsche Bank
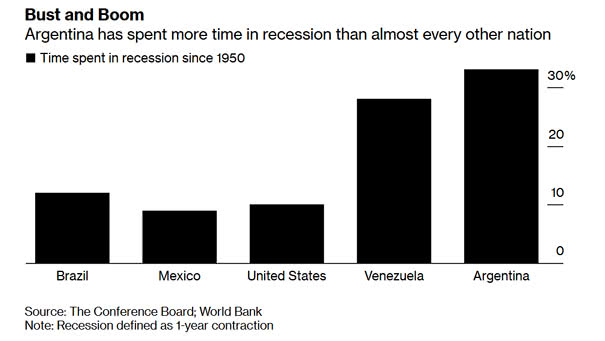
Time in Recession Since 1950, the United States has spent 10% of the time in recession compared to 33% for Argentina. Image: Bloomberg
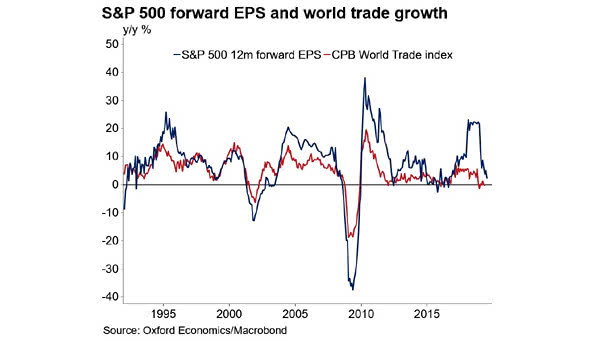
S&P 500 Forward EPS and World Trade Growth The chart shows a pretty good correlation between the S&P 500 forward 12-month EPS and the CPB World Trade Index. Image: Oxford Economics, Macrobond