Cash Use vs. Internet Penetration Around the World
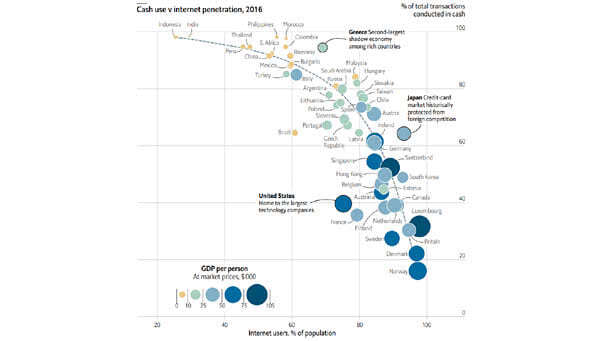
Cash Use vs. Internet Penetration Around the World Interesting correlation between the use of cash and the internet users as percentage of the population. Image: The Economist
Cash Use vs. Internet Penetration Around the World Interesting correlation between the use of cash and the internet users as percentage of the population. Image: The Economist
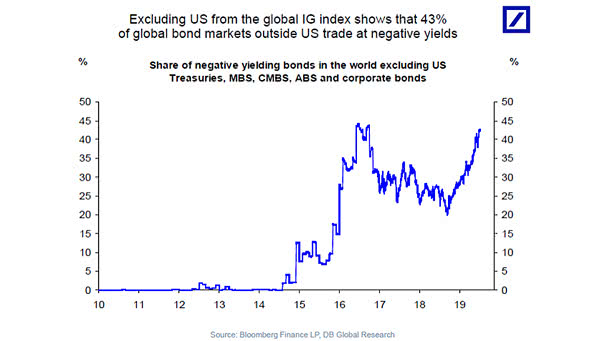
Share of Negative Yielding Bonds in the World Excluding U.S. The chart shows that 43% of global bonds ex-U.S. trade at negative yields. Image: Deutsche Bank Global Research
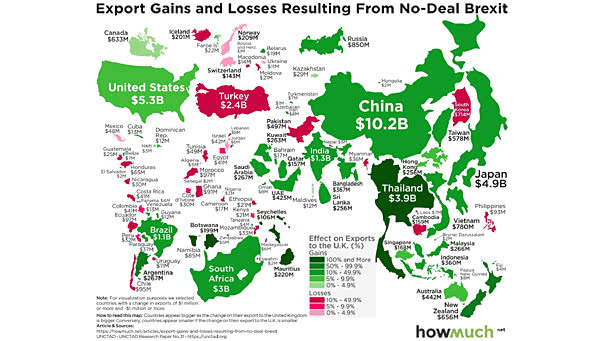
How “NO-DEAL Brexit” Would Affect the World’s Economy? What could a no-deal Brexit mean for developing countries? Main losers if there is a no-deal Brexit: European Union and Turkey. Main winners if there is a no-deal Brexit: China, USA, Japan, Thailand, South Africa, India, Brazil. Image: howmuch.net, UNCTAD
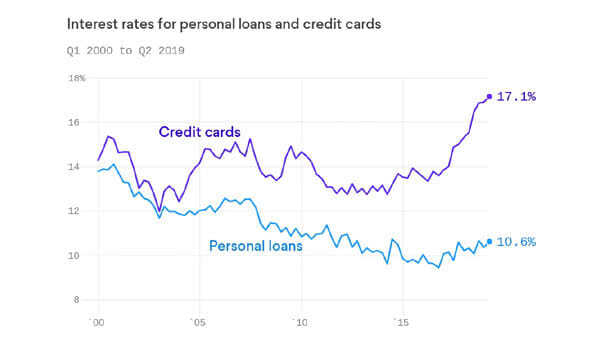
Interest Rates for Personal Loans and Credit Cards Diverge Due to the growing spread, many borrowers take out personal loans to pay off credit card debt. Image: Axios
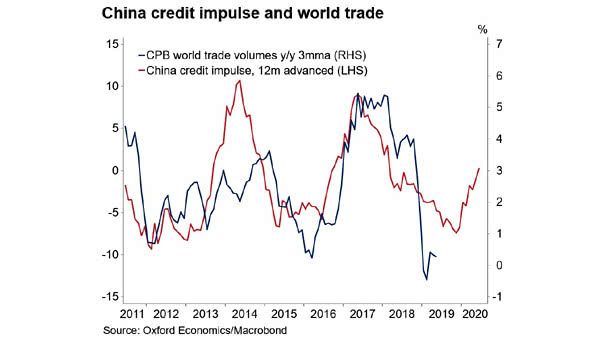
China Credit Impulse Leads World Trade The chart suggests that China credit impulse leads world trade by 12 months. World trade is expected to turn positive in coming months. Credit impulse is the change in new credit issued as a percentage of GDP. Image: Oxford Economics, Macrobond
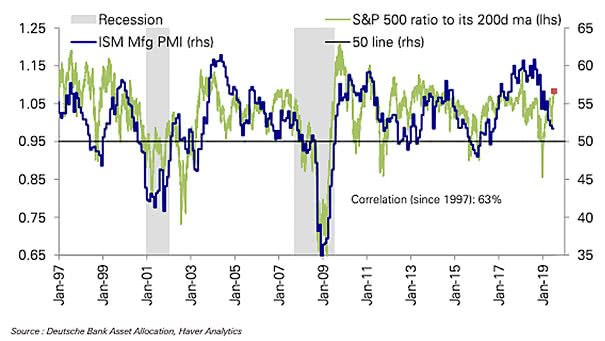
ISM Manufacturing Index vs. S&P 500 The U.S. stock market is pricing in a strong rebound in the ISM Manufacturing Index (R² = 0.40 since 1997). Image: Deutsche Bank
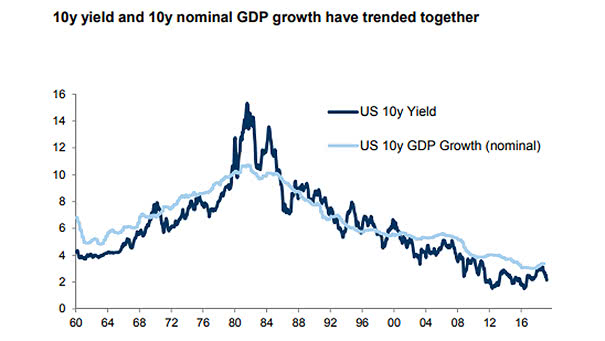
U.S. 10-Year Treasury Bond Yield and U.S. 10-Year Nominal GDP The long-term trend in U.S. nominal GDP growth is a good indicator of U.S. nominal bond yields. Image: Goldman Sachs Global Investment Research
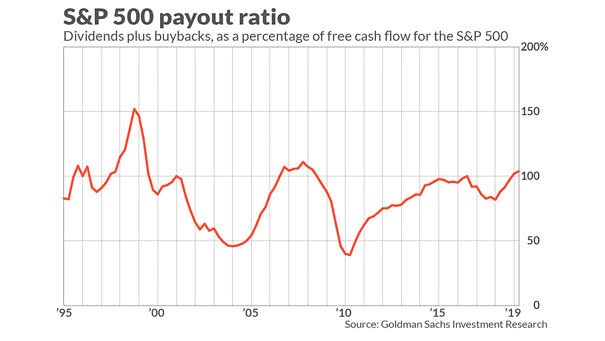
S&P 500 Payout Ratio Stock buybacks and dividends as a percentage of free cash flow are reaching dangerous levels. Image: MarketWatch
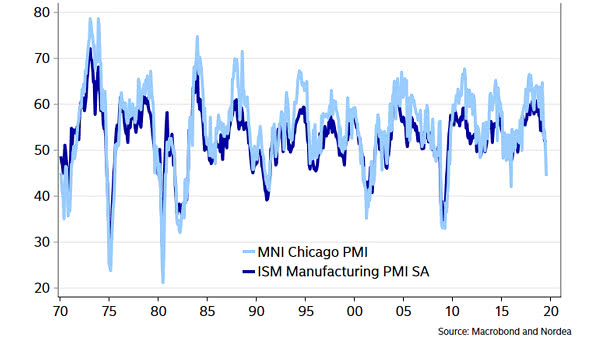
ISM Manufacturing Index vs. Chicago PMI Index The Chicago PMI Index fell to 44.4 in July suggesting a weakness in the ISM Manufacturing Index. Image: Nordea and Macrobond
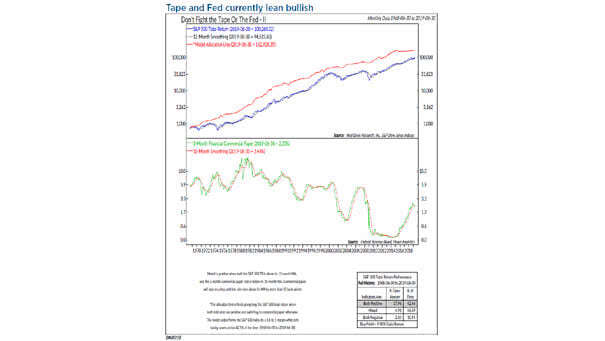
Don’t Fight the Tape or the Fed When the Tape and Fed lean bullish, as today, the S&P 500 has historically risen at 17.96%/year since 1968 vs. 9.98%/year on a buy-and-hold basis. Image: Ned Davis Research
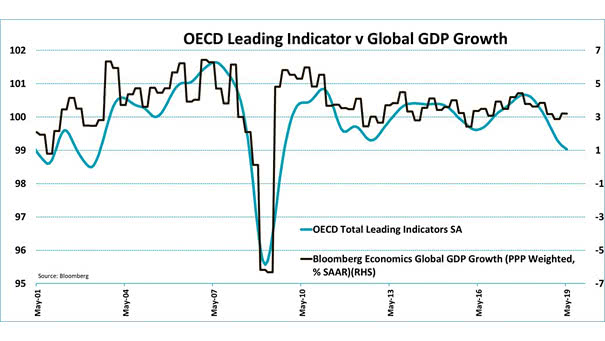
OCDE World Leading Indicator vs. Global GDP Growth The OCDE world leading indicator suggests a weakness in global GDP growth. Image: Jeroen Blokland