Countries With the Highest Housing Bubble Risks
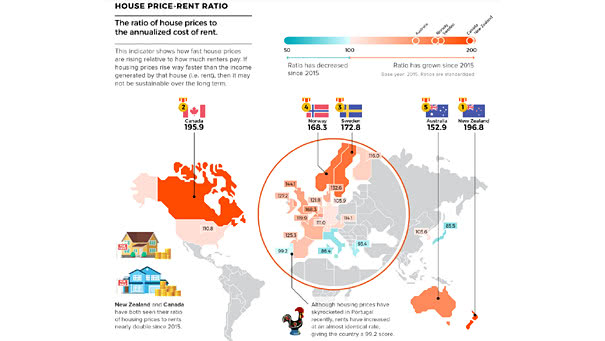
Countries With the Highest Housing Bubble Risks Detecting and measuring asset bubbles is not always an easy task, but in many countries, housing prices are rising faster than rental rates. Image: Visual Capitalist