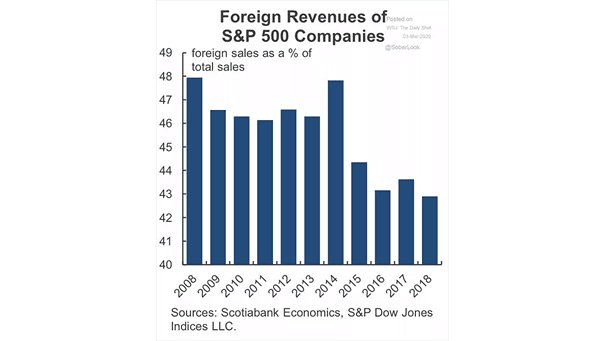
S&P 500 After 5% Gain In May

S&P 500 After 5% Gain In May Historically, when May delivers a gain of over 5%, June tends to see continued strength, and the following 12 months have always produced positive returns, averaging close to 20% since 1985. Image: Carson Investment Research

Median Annual S&P 500 Total Return Based on Nominal 10-Year U.S. Treasury Yield

Median Annual S&P 500 Total Return Based on Nominal 10-Year U.S. Treasury Yield There is no consistently clear or stable relationship between bond yields and equity returns. Their correlation is dynamic and shaped by various economic factors, including inflation, interest rates, and credit risk. Image: Goldman Sachs Global Investment Research

Performance – S&P 500 vs. 30-Year US Treasury vs. Trade-Weighted U.S. Dollar

Performance – S&P 500 vs. 30-Year US Treasury vs. Trade-Weighted U.S. Dollar The simultaneous decline of U.S. equities, bonds, and the dollar is rare—especially during periods of market stress— and signals a potential shift in global investor sentiment and the structural underpinnings of U.S. financial markets. Image: Goldman Sachs Global Investment Research

Average S&P 500 Return in Session Following a Down Day

Average S&P 500 Return in Session Following a Down Day In 2025, investors who bought the dip in the U.S. stock market experienced the highest next-day returns in over 30 years, with the S&P 500 averaging a 0.36% gain in the trading session following a down day. Image: Yahoo Finance

Money Market Fund Assets as a Percent of S&P 500 Market Capitalization

Money Market Fund Assets as a Percent of S&P 500 Market Capitalization Despite record levels of cash in money market funds, cash on the sidelines is not elevated relative to the S&P 500 market capitalization. In fact, the ratio of money market funds assets to S&P 500 market cap is near historic lows. Image: J.P.…

After-Tax Nonfinancial Corporate Profits as Share of Gross Value Added

After-Tax Nonfinancial Corporate Profits as Share of Gross Value Added While U.S. corporate profits fell in Q1 2025 due to higher costs and economic uncertainty, they remain historically high, reflecting both the strength and the vulnerability of large companies in the current economic climate. Image: Bloomberg

S&P 500 Performance One Year After 5% Monthly Gains

S&P 500 Performance One Year After 5% Monthly Gains There’s very good news for bulls: Since 1950, whenever the S&P 500 has gained more than 5% in May, it has historically been higher 12 months later, with an average increase of 19.9%. Image: Carson Investment Research

Valuation – U.S. Equities vs. Rest of World – 12-Month Forward PE Ratios

Valuation – U.S. Equities vs. Rest of World – 12-Month Forward PE Ratios U.S. equities trade at historically high valuations versus global peers, with the premium widening. While strong fundamentals support this, it also poses risks if growth expectations decline or macroeconomic conditions worsen. Image: Deutsche Bank

U.S. Current Activity Indicator

U.S. Current Activity Indicator U.S. soft data and growth signals have improved slightly, largely due to a more favorable trade policy outlook following the partial rollback of tariffs. Image: Goldman Sachs Global Investment Research

S&P 500 Performance After at Least 15 Weeks of AAII Bears over Bulls Ends

S&P 500 Performance After at Least 15 Weeks of AAII Bears over Bulls Ends A streak of 15 consecutive weeks with more bears than bulls in the AAII survey is rare—only four other periods have lasted this long. In each case, the S&P 500 was higher 12 months later, with an average gain of 27.5%.…

Impact of Higher Tariffs on the U.S. Core PCE Price Index

Impact of Higher Tariffs on the U.S. Core PCE Price Index The coming inflation rebound is expected be limited in scope and duration, meaning it is unlikely to trigger the kind of persistent inflation psychology that can drive a sustained wage-price spiral. Image: Goldman Sachs Global Investment Research