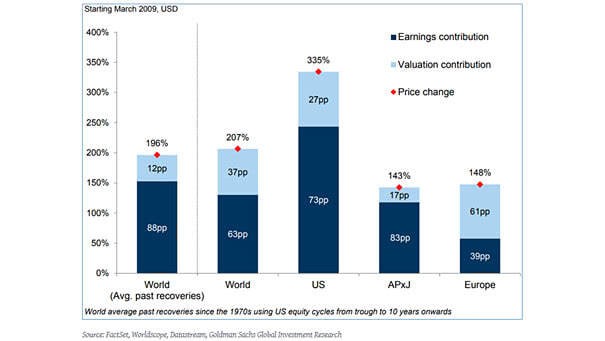
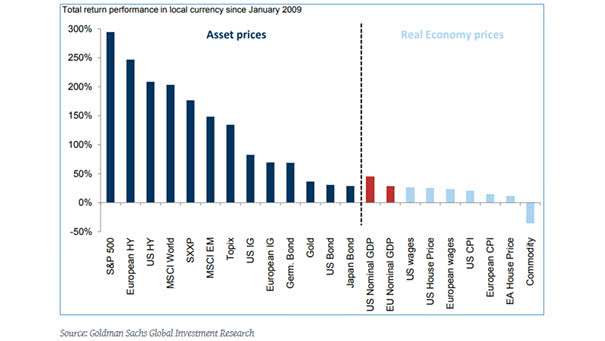
Detecting and Measuring Asset Bubbles

Detecting and Measuring Asset Bubbles Detecting and measuring asset bubbles is not always an easy task. This chart puts into perspective the current U.S. households financial assets to GDP and the U.S. federal debt as percentage of GDP.

U.S. Recession Probabilities Over the Next Year from the Yield Curve

U.S. Recession Probabilities Over the Next Year from the Yield Curve Deutsche Bank has calculated the U.S. recession probabilities over the next year, using the slope of various yield curves. PCA (Principal Component Analysis) is used to estimate the effects of yield curve movements. Image: Deutsche Bank

Investor Allocation by Region in the U.S.

Investor Allocation by Region in the U.S. This chart is a good example of investment bias and shows the likelihood of owning stocks in an industry vs. national average. Picture Source: J.P. Morgan Asset Management

S&P 500 and U.S. Economic Surprises

S&P 500 and U.S. Economic Surprises This chart shows the current divergence between the S&P 500 YoY and the 12-month moving average of the U.S. economic surprise index. Image: Oxford Economics and Macrobond

Time, Diversification and the Volatility of Returns

Time, Diversification and the Volatility of Returns This chart shows how the volatility of returns decreases over time (range of equity, bond and blended total return). Picture Source: J.P. Morgan Asset Management

The Yield Curve Leads VIX (Volatility) by Three Years

The Yield Curve Leads VIX (Volatility) by Three Years Is more volatility expected ahead? This chart suggests that the CBOE Volatility Index or VIX usually follows the U.S. 10-year vs. 3-month Treasury spread (inverted) with a 3-year lag. You may also like “VIX is in a Transitory State” and “Fed Funds Target Rate and VIX.”…

Risk and Return by Asset Class

Risk and Return by Asset Class This interesting chart shows risk and return by asset class since 1970 and since 2009. Image: Fidelity Investments

S&P 500 vs. U.S. Treasuries

S&P 500 vs. U.S. Treasuries Despite its all-time high, the S&P 500 is below the Bloomberg Barclays U.S. Treasury Index. Picture Source: Bloomberg