Semiconductor Sales vs. Global Earnings per Share
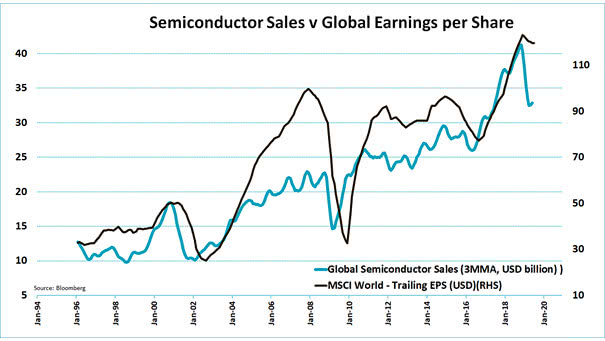
Semiconductor Sales vs. Global Earnings per Share The chart shows that semiconductor sales suggest a collapse in corporate earnings. Image: Jeroen Blokland
Semiconductor Sales vs. Global Earnings per Share The chart shows that semiconductor sales suggest a collapse in corporate earnings. Image: Jeroen Blokland
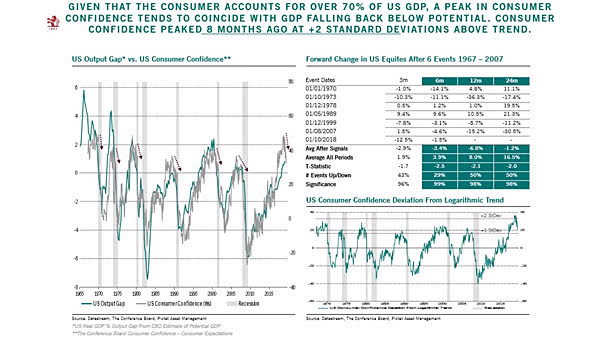
U.S. Output Gap vs. U.S. Consumer Confidence Great chart showing the strong correlation between U.S. consumer confidence and the U.S. Output Gap. U.S. consumer confidence always peaks before a recession. Image: Pictet Asset Management
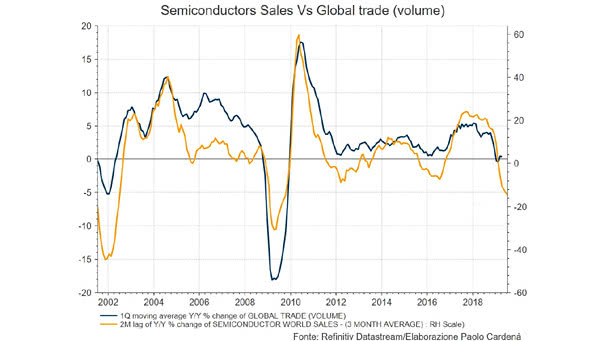
Semiconductor Sales vs. Global Trade (volume) Interesting chart showing the correlation of 0.78 between semiconductor sales and global trade (volume). Image: Paolo Cardena
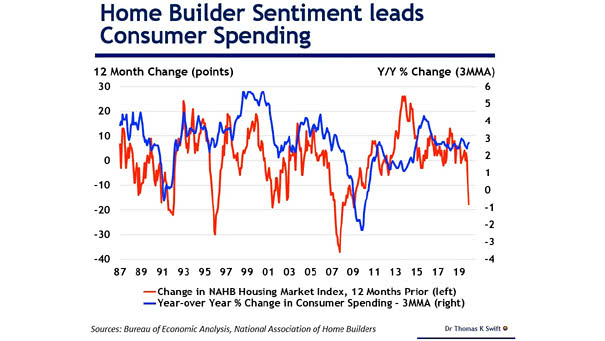
Home Builder Sentiment Leads Consumer Spending Interesting chart suggesting that the NAHB housing market index leads the change in consumer spending. The latest reading for July suggests that the outlook for the U.S. economy is expected to slow. Image: Dr Thomas Kevin Swift
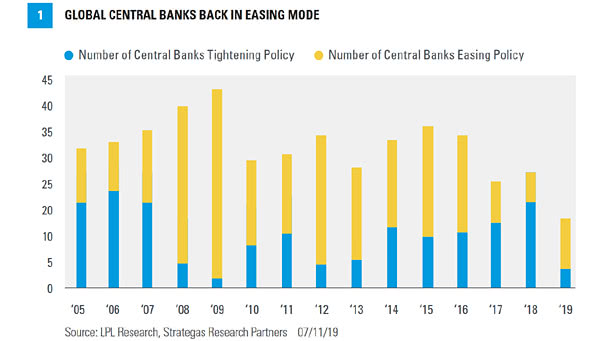
Global Central Banks Back In Easing Mode Some of the major central banks are hitting the pause button and are back in easing mode. Image: LPL Research
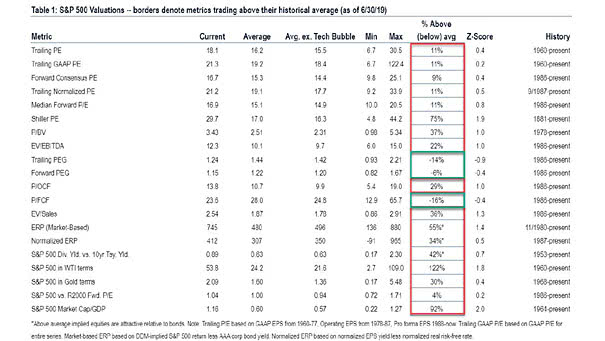
S&P 500 Valuation Above Historical Average The S&P 500 is overvalued on 17 of 20 valuation metrics. You may also like our “Stock Market Valuation.” Image: Bank of America
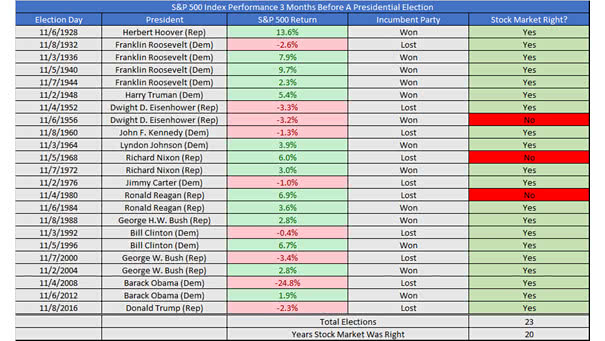
S&P 500 Index Performance 3-Months Before A Presidential Election The S&P 500 performance 3-months before the U.S. Presidential election is very accurate in predicting the election winner. You may also like “Unemployment and U.S. Presidential Elections.” Image: Ryan Detrick, LPL Financial LLC
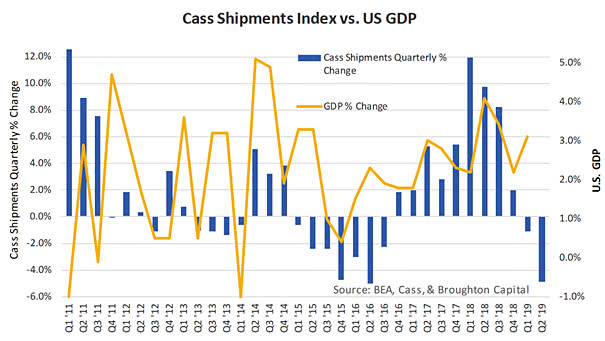
Cass Freight Shipments Index vs. U.S. GDP The Cass Freight Shipments Index is a relative good predictive indicator of the U.S. economy. It suggests a weakness in U.S. GDP in Q2 2019. The Cass Freight Index is a measure of monthly North American freight activity. You may also like “ISM Manufacturing Index vs. Cass Freight Index.”…
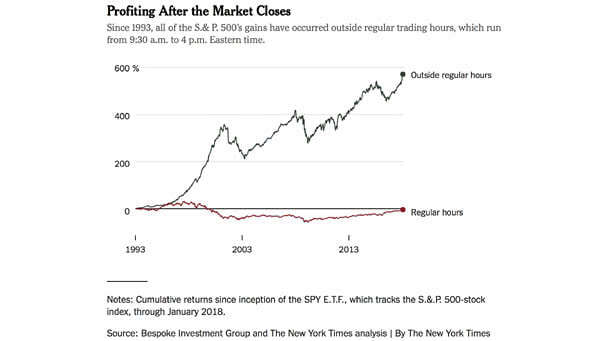
S&P 500 Gains Outside Regular Trading Hours The S&P 500 loves the night, after the market closes. Since 1993, the real profits have come outside regular trading hours. Image: The New York Times, Bespoke Investment Group
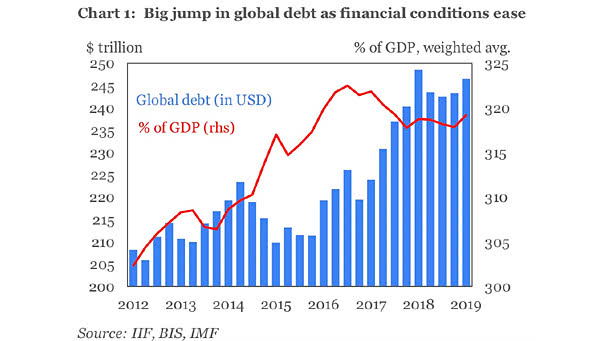
Global Debt Nears Record Global debt hits $246 trillion (or 320% of GDP) and is just $2 trillion shy of all-time high. You may also like “Total Debt by Sector for Developed & Emerging Economies.” Image: International Monetary Fund
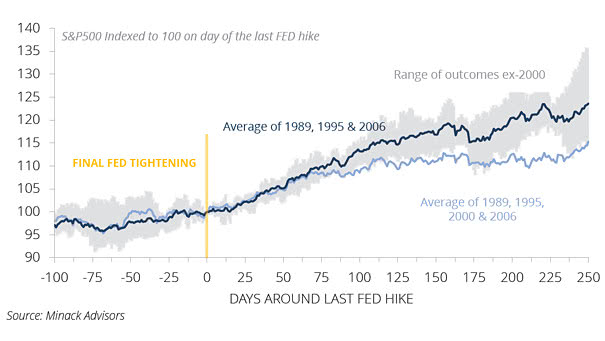
S&P 500 Around the End of Fed Tightening As the chart shows, the S&P 500 has performed well on average, around the end of Fed tightening. You may also like “S&P 500 Performance Around Previous Fed Cuts.” Image: Morphic Asset Management Pty Ltd