Corporate Leverage in the U.S.
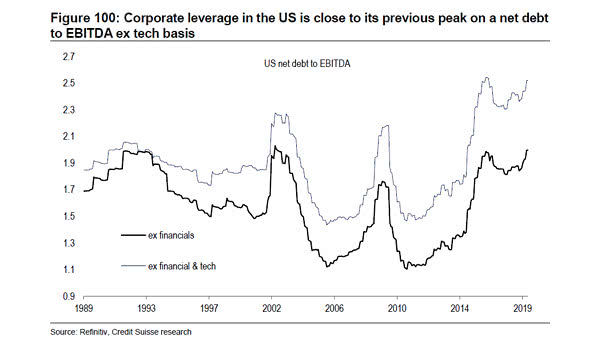
Corporate Leverage in the U.S. U.S. corporate debt is high. This chart shows that U.S. corporate leverage is close to its previous peak on a net debt to EBITDA. You may also like “U.S. Leveraged Loan Index Rating Breakdown: 2008 vs. 2019.” Image: Credit Suisse Research