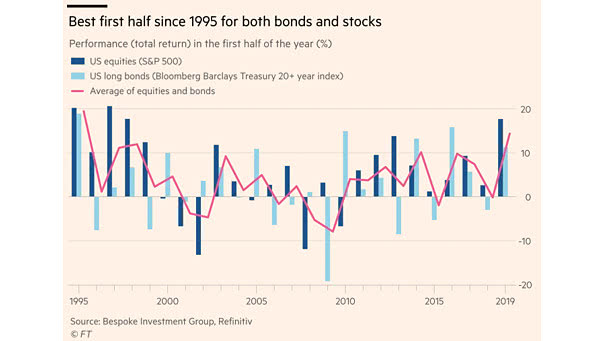
Economic Expansions Don’t Die of Old Age
Economic Expansions Don’t Die of Old Age Today, the current economic cycle is the longest expansion. Image: Oxford Economics
MSCI Emerging Markets Index vs. World Semiconductor Sales This great chart suggests that world semiconductor sales lead the MSCI emerging markets index by 3 months. Very interesting chart before investing in emerging market equities. Country weights of the MSCI Emerging Markets Index: 33% China, 13.02% Korea, 11.35% Taiwan. Image: Nordea and Macrobond
S&P 500 All-Time Highs Great chart showing the 1,140 all-time highs of the S&P 500 since the Second World War. Image: Ryan Detrick, LPL Financial LLC
Global Equity Fund Flows This great chart from Deutsche Bank shows that equity outflows over the last 6 months are now the largest on record. In 2011 and 2016, it was similar and equities rose significantly. Image: Deutsche Bank
Gold Price vs. U.S. Dollar Currently, when the U.S. dollar is weaker, the price of gold is higher, as shown in this nice chart below. But it’s not always the case. Image: ANZ Research
Expected Fed Funds Rate as of June 20, 2019 Fed funds futures for January 2021 imply an expected rate of only 1.26% (traders are pricing in more than four full cuts). You may also like “Markets Have Accurately Priced in Cuts before Easing Cycles Begin.”
The S&P 500’s Drawdown and The Target Fed Funds Rate Fed rate cuts have generally been associated with recessions and drawdowns. Image: Bianco Research
Change in the Summary of Economic Projections This chart shows the change in the summary of economic projections from March to June 2019. Image: Evercore ISI
Years Without a 20% Gain for the S&P 500 Index This great chart shows the number of years without a 20% gain since 1950. Could the S&P 500 gain 20% this year? Image: LPL Research
Most Important Variables Explaining the S&P 500’s YoY Return Today, the two most important variables explaining the S&P 500’s YoY return: FOMC rate change and U.S. hard economic data. Image: Arbor Research & Trading LLC
Dow Jones Industrial Average Around First Fed Rate Cut After first Fed rate cut, the Dow Jones Industrial Average’s gains are +24% on average when no recession, and +11% with a recession within 12 months. Image: Ned Davis, Ed Clissold