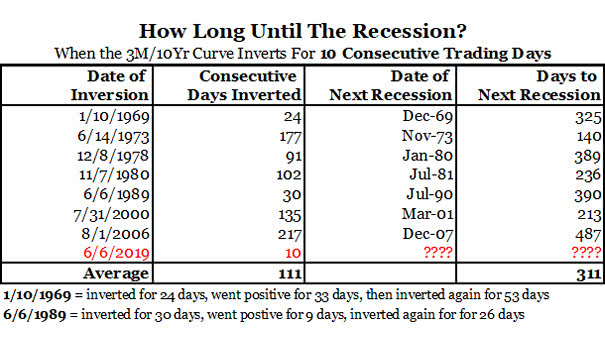
Decomposing the U.S. 10-Year minus 3-Month Treasury Yield Spread since 2013

Decomposing the U.S. 10-Year minus 3-Month Treasury Yield Spread since 2013 This great chart shows that the “Global Economic Data” variable has a significant impact on the U.S. 10-year minus 3-month Treasury yield spread since 2018. An R² of 0.902 means that more than 90 percent of the variance in the U.S. 10-year minus 3-month Treasury yield spread…

Can The U.S. 10-Year Treasury Yield Fall Further?

Can The U.S. 10-Year Treasury Yield Fall Further? Well, according to this chart, the U.S. 10-year treasury yield could fall further. The chart suggests that G4 central bank assets as percentage of GDP (1-year change) lead U.S. 10-year Treasury yield (1-year change) by one year. Image: Macrobond

The U.S. Corporate Bond Debt Rated ‘BBB’ Exceeds $3 trillion

The U.S. Corporate Bond Debt Rated ‘BBB’ Exceeds $3 trillion The U.S. corporate bond debt rated ‘BBB’ exceeds $3 trillion. That’s 53% of investment-grade bonds in the United States. Any drop in the credit ratings could amplify the next recession: many investment grade investors own BBB-rated bonds, but are not allowed to hold junk-rated bonds.…

Total Global Carbon Emissions (CO2)

Total Global Carbon Emissions (CO2) China, the United States, and India account for almost half the world’s carbon emissions. You may also like “Annual Carbon Emissions in Tons.” Image: Visual Capitalist

Expected Fed Funds Rate as of June 1, 2019

Expected Fed Funds Rate as of June 1, 2019 Traders are pricing in two full cuts in the fed funds target before the end of 2019. Fed funds futures for January 2020 imply an expected rate of only 1.85%.  Let’s hope the Fed gets the message from the market. You may also like “Markets Have…

Distribution of Forward Returns by 200MA Slope

Distribution of Forward Returns by 200MA Slope This great chart shows the distribution of forward returns when the slope of S&P 500’s 200-day moving average is lower, flat or higher. Image: Ritholtz Wealth Management

Gold Reserves Around the World

Gold Reserves Around the World The U.S. has the world’s largest gold reserves, followed by Germany, the International Monetary Fund (IMF) and France. Image: howmuch.net Click the Image to Enlarge

Markets Have Accurately Priced in Cuts before Easing Cycles Begin

Markets Have Accurately Priced in Cuts before Easing Cycles Begin Orange lines mark days when markets priced in a rate cut. In recent history, it occurs between 33 and 281 business days before fed cut. The average is 120 business days. So, the Fed’s rate cut could take place in September 2019. You may also…