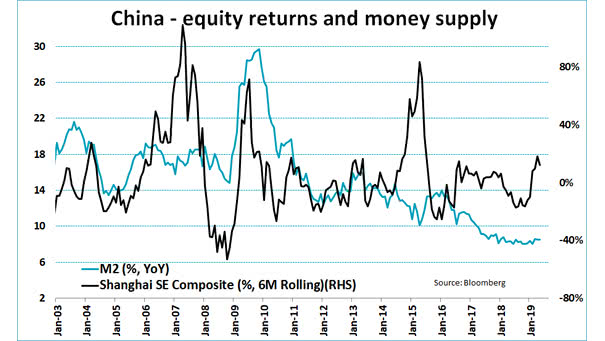
China – Equity Returns and Money Supply
China – Equity Returns and Money Supply This chart shows the relationship between M2 money supply and China’s stock market since 2003. Image: Jeroen Blokland
China – Equity Returns and Money Supply This chart shows the relationship between M2 money supply and China’s stock market since 2003. Image: Jeroen Blokland
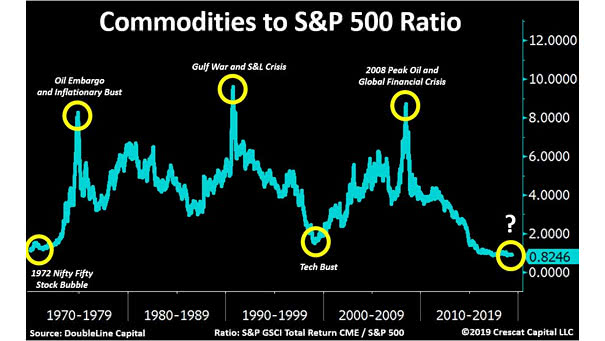
Commodities to S&P 500 Ratio This great chart shows that the ratio is currently at a 50 year low and far below the long-term average. Image: Crescat Capital LLC
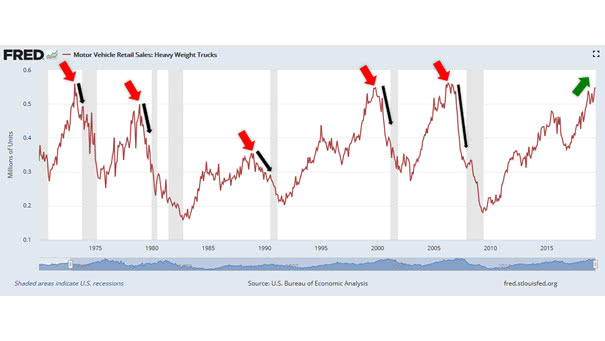
Heavy Truck Sales as Recession Indicator Historically, before recessions, heavy truck sales tend to peak (red arrow) and then decline (black arrow). Currently, heavy truck sales have a nice upward slope and show no sign of peaking. So, it suggests that there is no imminent recession on the horizon. You may also like “U.S. Heavy…
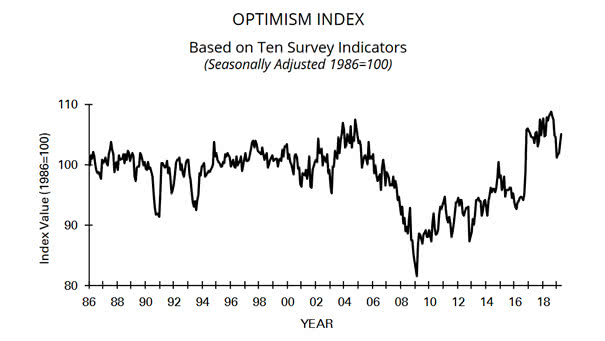
Small Business Optimism Roars Back, Rivaling Historic Highs Small Business Optimism Index improved: expectations for sales, business conditions, and expansion rose. That’s good news for the U.S. economy. See why the “Small Businesses Optimism Index” is a good recession indicator. Image: National Federation of Independent Business (NFIB)
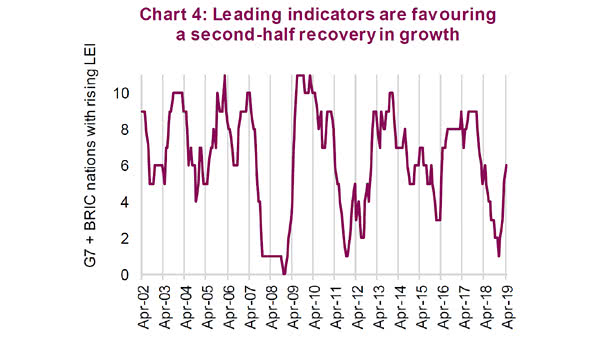
Second-half Recovery in Growth? Better economic data could extend the business cycle. Currently, G7 & BRIC leading indicators remain encouraging and suggest no imminent recession. Image: Richardson Wealth
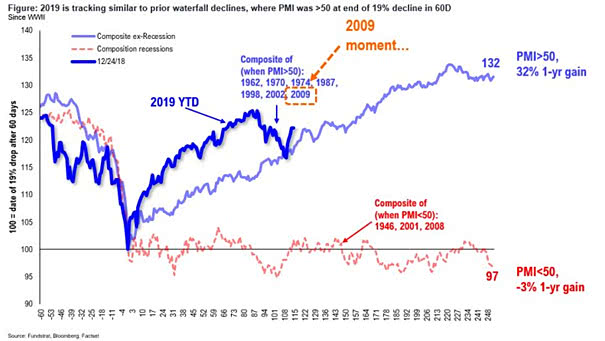
2019 Is Tracking Similar to Prior Waterfall Declines Where PMI was above 50 at end of 19% decline in 60 days. So, it suggests 3,100 for the S&P 500 by year end. Image: Fundstrat
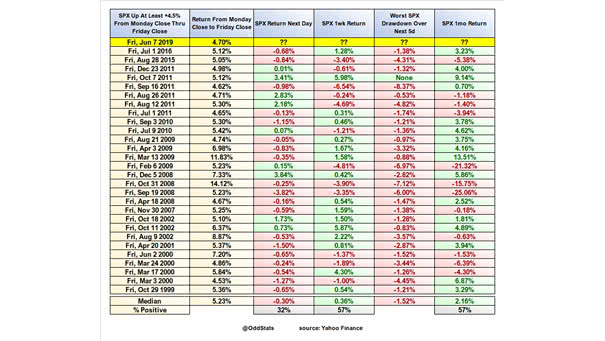
S&P 500 Up at Least +4.5% from Monday Close through Friday Close Last week, the S&P500 was up at least +4.5% from Monday’s close through Friday’s close. History shows it is not bullish. Image: OddStats
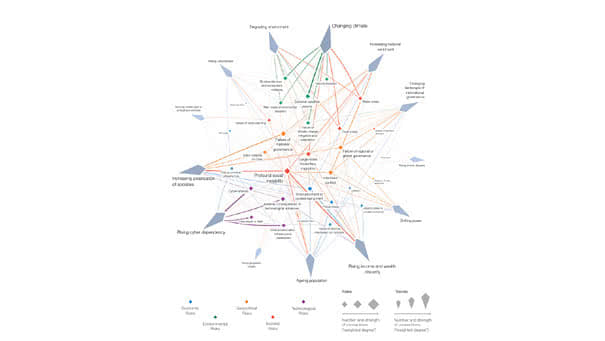
The Top 10 Risks to the Global Economy US-China trade conflict, US corporate debt burden, and emerging-markets crisis are the main global risks according to the Economist Intelligence Unit (EIU). Image: World Economic Forum
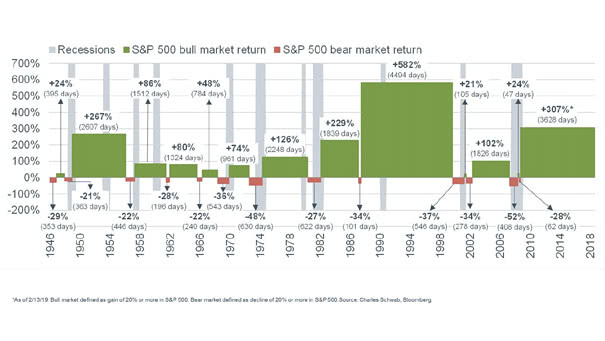
Fear Of Recessions? S&P 500 Bull and Bear Markets since 1946 A long-term investor should put downturns in perspective. Image: Charles Schwab
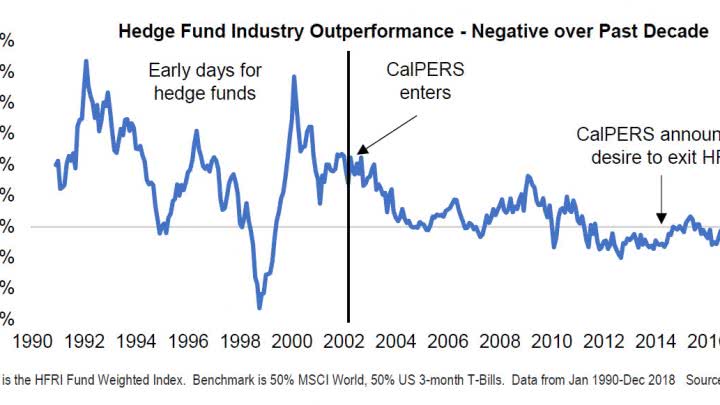
Hedge Fund Industry Outperformance – Negative over Past Decade The chart below shows how it’s hard to beat the market over time. Image: Greenline Partners LLC
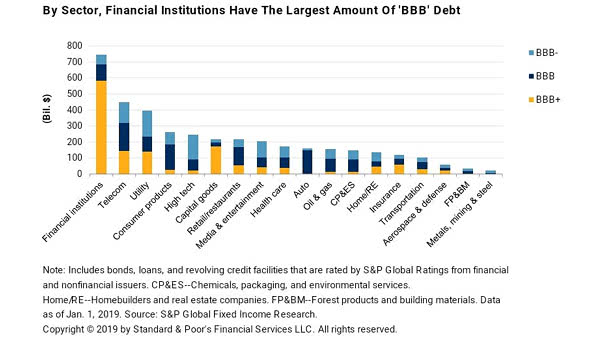
BBB Debt by Sector in the U.S. By sector in the U.S., financial institutions have the largest amount of ‘BBB’ debt: $744 billion. That’s 53% of investment-grade bonds in the United States. You may also like “The U.S. Corporate Bond Debt Rated ‘BBB’ Exceeds $3 trillion.” Image: S&P Global Fixed Income Research