Market Sentiment – Levkovich Index
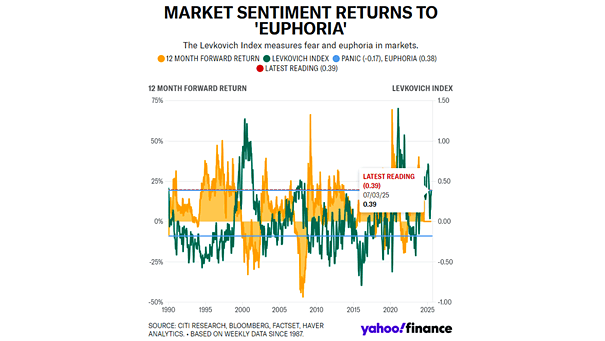
Market Sentiment – Levkovich Index The Levkovich Index, or Panic/Euphoria Model, is currently at “euphoria,” indicating strong investor optimism. This often serves as a contrarian signal that equities may face downward pressure over the next 12 months. Image: Yahoo Finance