Global Gold Reserves vs. Global Dollar Reserves
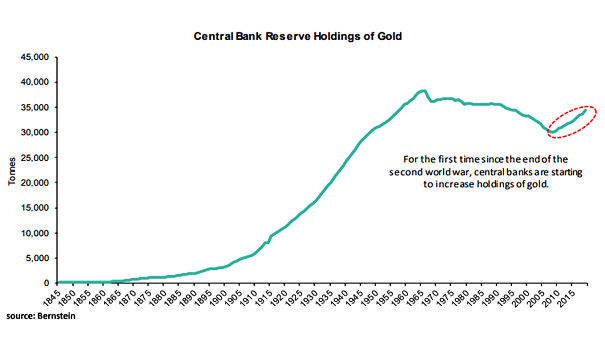
Global Gold Reserves vs. Global Dollar Reserves Amid rising geopolitical tensions and a shifting global financial landscape, central banks worldwide are increasingly favoring gold over the U.S. dollar as a reserve asset. Image: Blomberg