U.S. Core CPI and Headline Inflation

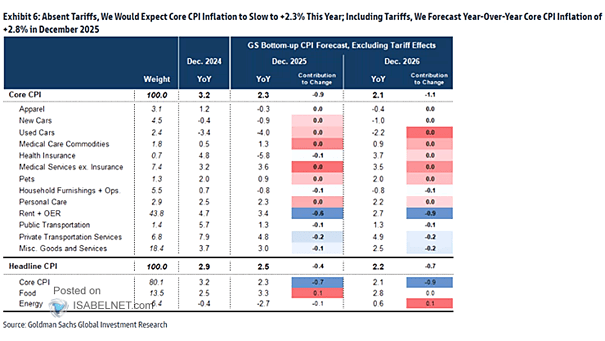
U.S. Core CPI and Headline Inflation Goldman Sachs projects U.S. core CPI inflation at 3.3% year-over-year by the end of 2025, factoring in tariffs, and expects it to gradually ease to 2.6% in 2026 despite ongoing inflationary pressures. Image: Goldman Sachs Global Investment Research

Cross Asset Flows as a % of Assets

Cross Asset Flows as a % of Assets Money market funds continue to attract strong investor interest, providing safe and profitable short-term opportunities in the current high-interest-rate environment. Image: Deutsche Bank Asset Allocation

S&P 500 Alternating Higher and Lower Days in a Row

S&P 500 Alternating Higher and Lower Days in a Row Over seven days in August, the S&P 500’s alternating higher and lower closes signal a choppy trading environment, consistent with usual seasonal patterns amid ongoing macroeconomic and geopolitical uncertainties. Image: Carson Investment Research

S&P 500 Index and Blended Forward EPS

S&P 500 Index and Blended Forward EPS Citigroup strategists raised their year-end S&P 500 target to 6,600 points, up from 6,300, expecting that tax cuts introduced in July 2025 will counterbalance the negative impact of tariffs on U.S. companies. Image: Bloomberg

S&P 500 Net Long Futures Contracts

S&P 500 Net Long Futures Contracts Despite some profit-taking, asset managers and leveraged funds remain strongly net long on S&P 500 futures, signaling a positive outlook for the U.S. stock market. Image: Deutsche Bank

U.S. Recession Probability

U.S. Recession Probability Both the S&P 500 equity market and the corporate bond market reflect investor expectations that a U.S. recession is unlikely or at least of low probability in the coming months. Image: J.P. Morgan Flows and Liquidity

Copper to Gold Ratio vs. U.S. ISM Manufacturing

Copper to Gold Ratio vs. U.S. ISM Manufacturing A falling copper/gold ratio points to slower U.S. economic growth, reflecting investor caution toward the near-term economic environment. Image: Bloomberg

Corporate America’s Announced Buybacks

Corporate America’s Announced Buybacks July’s record $166 billion in share repurchases played a key role in driving an annual buyback pace that may exceed $1 trillion in 2025, reflecting solid corporate confidence and return-of-capital strategies. Image: Bloomberg

U.S. Household Ownership of Stocks, % of Total Assets

U.S. Household Ownership of Stocks, % of Total Assets An elevated equity exposure among U.S. households does not necessarily signal an imminent market downturn, but it underscores the importance of cautious investment strategies and prudent portfolio management. Image: J.P. Morgan

Volatility Control Funds Estimated Equity Allocation

Volatility Control Funds Estimated Equity Allocation Vol-control funds have near-record equity exposure by historical standards, sitting at the 97th percentile, which reflects strong confidence in the equity market risk environment. Image: Deutsche Bank Asset Allocation