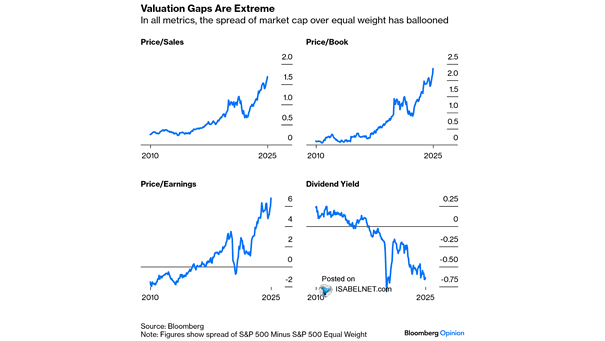
Valuations – Spread of S&P 500 Minus S&P 500 Equal Weight
Valuations – Spread of S&P 500 Minus S&P 500 Equal Weight The significant valuation gaps between the cap-weighted and equal-weighted S&P 500 result from the high valuations and growth expectations of large companies, which emphasize market concentration and investment risks. Image: Bloomberg