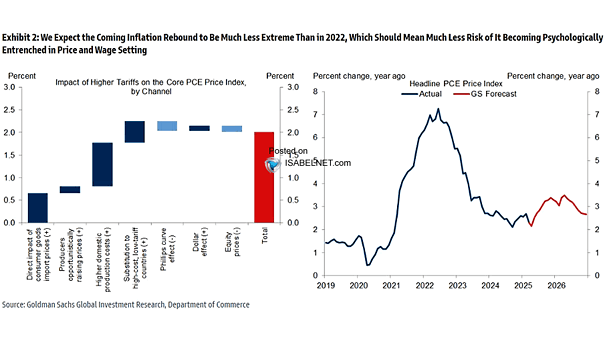
ISABELNET Cartoon of the Day
ISABELNET Cartoon of the Day Even bulls and bears are calling a truce this Easter Monday—time to trade market chaos for chocolate eggs! Happy Easter Monday, Everyone!🐰😎
U.S. True Financial Conditions Index The U.S. True Financial Conditions Index stands at 6, indicating a slightly accommodative financial environment. Image: Gavekal, Macrobond
Contributions to Annualized U.S. PCE Growth The U.S. stock market’s recent underperformance is expected to reduce the wealth effect, turning it from a boost to a drag on consumption and increasing the risk of a broader economic slowdown as consumer spending weakens. Image: Goldman Sachs Global Investment Research
S&P 500 Intraday Swings Recent S&P 500 volatility, characterized by intraday swings exceeding 10% and VIX spikes echoing 2008 and COVID-era turbulence, appears to be stabilizing. Image: Bloomberg
Gold vs. 30-Year U.S. Treasury Bond Gold is increasingly being positioned as an alternative to U.S. Treasury bonds. Image: Deutsche Bank
ISABELNET Cartoon of the Day The S&P 500 took a 1.50% dip this week, but bears are open to talks if bulls show respect! Happy Easter Weekend, Everyone! 🐰😎
Notional Volume Traded in Listed U.S. Equity Options Thanks to strong participation from both retail and institutional investors, U.S. equity options are seeing rising average daily trading volumes—a trend that shows no signs of slowing down. Image: Goldman Sachs Global Investment Research
VIX Buy Signals After VIX surges, the S&P 500 rose in 85% of instances over the next few months—but not during recessions. Image: J.P. Morgan
ISABELNET Cartoon of the Day U.S. tariff policy is causing substantial harm on both the American brand and the broader economy. Rising costs, declining foreign tourism, and boycotts of American products are set to cost the U.S. economy billions of dollars. Have a Great Day, Everyone! 😎
S&P 500 and VIX Above 50 The VIX rose above 60 during the 2008 financial crisis and the 2020 COVID-19 crash. In both cases, the stock market had already bottomed before the VIX dropped below 31. This pattern seems to be repeating in 2025. Image: Fundstrat Global Advisors, LLC
S&P 500 Shiller CAPE vs. Subsequent Calendar-Year Total Return In the short run, the Shiller CAPE ratio often gets lost in the market’s noise. Over five to ten years, however, its warning grows clearer: the higher the valuations, the thinner the returns. Image: Goldman Sachs Global Investment Research