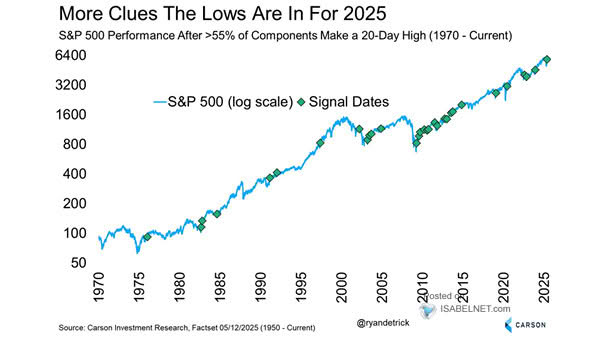
MSCI AC World – Bear Market Rallies
MSCI AC World – Bear Market Rallies Since the 1980s, there have been 19 global bear market rallies, lasting 44 days on average with MSCI AC World returns of 10–15%. Image: Goldman Sachs Global Investment Research
Valuation – Consensus Forward P/E vs. Expected EPS Growth The P/E premium reflects higher expected EPS growth, supported by a strong current correlation between EPS growth forecasts and P/E multiples. Image: Goldman Sachs Global Investment Research
S&P 500 Daily % Range The S&P 500 surged 9.52% on Wednesday, its third-largest single-day gain since WWII, with an intraday range of 10.77%. Image: The Daily Shot
Junk and Investment Grade Credit Spreads Corporate bond yield spreads are often used as a gauge of financial market stress. They can provide insights into the likelihood of an economic downturn, but they are not foolproof predictors. Image: Real Investment Advice
S&P 500 After VIX Spikes >50 (Intraday), First Instance in a Month An intraday VIX spike to 50, often triggered by panic-driven market declines, typically signals a recovery ahead. Historically, the S&P 500 has gained an average of 20% in the year following such events. Image: Carson Investment Research
Sensitivity of S&P 500 Returns to EPS and P/E Scenario Goldman Sachs projects S&P 500 EPS at $253 for 2025, driven by economic slowdowns, tariff pressures, and inflationary risks. Image: Goldman Sachs Global Investment Research
ISABELNET Cartoon of the Day Believing Trump’s tariffs won’t affect Americans is akin to hoping to win the lottery without purchasing a ticket—wishful thinking and highly unlikely! Have a Great Day, Everyone! 😎
Different Type of Bear Markets While both cyclical and event-driven bear markets tend to drop by approximately 30%, their durations vary. Cyclical bear markets average two years, whereas event-driven ones last about eight months and recover within a year. Image: Goldman Sachs Global Investment Research
S&P 500 Bear Markets Should the S&P 500 transition into a bear market, history shows that patient investors are often rewarded in the year and two-year windows after the bear market starts. Image: Carson Investment Research
Waterfall Declines in the S&P 500 Contrary to the widespread belief that markets systematically retest lows, analysis of waterfall declines since 1929 reveals that such occurrences are far from consistent. Image: Fundstrat Global Advisors, LLC
S&P 500 and Breadth-Based Stock Market Bottom Signal A signal indicating a potential market bottom, based on extreme breadth levels, has been triggered. Historically, such signals often precede market turning points but are not infallible and can sometimes appear prematurely. Image: Bloomberg