Proportion of S&P 500 Firms Mentioning Recession during Quarterly Earnings Calls
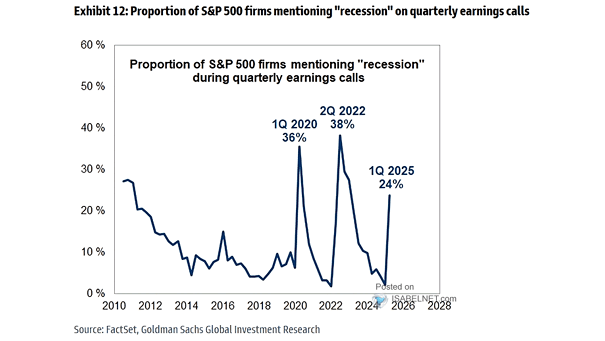
Proportion of S&P 500 Firms Mentioning Recession during Quarterly Earnings Calls The proportion of S&P 500 firms mentioning “recession” in their earnings calls has risen sharply to 24%, signaling growing worries about an economic slowdown despite continued positive earnings growth. Image: Goldman Sachs Global Investment Research