
ISABELNET Cartoon of the Day
ISABELNET Cartoon of the Day While bulls are toasting the S&P 500 gains this week, bears are busy Googling “emergency exits from a market rally.” Happy Friday, Everyone! 😎
ISABELNET Cartoon of the Day While bulls are toasting the S&P 500 gains this week, bears are busy Googling “emergency exits from a market rally.” Happy Friday, Everyone! 😎
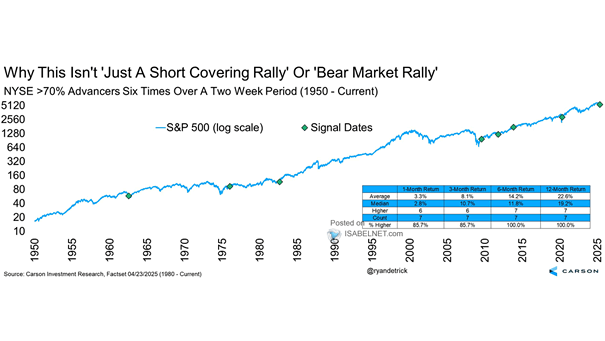
S&P 500 and NYSE >70% Advancers Six Times Over a Two Weeks Period Six trading days with NYSE advancers exceeding 70% within a two-week period historically signal a robust bullish phase—distinct from bear-market rallies—with an average 12-month S&P 500 gain of 22.6% since 1950. Image: Carson Investment Research
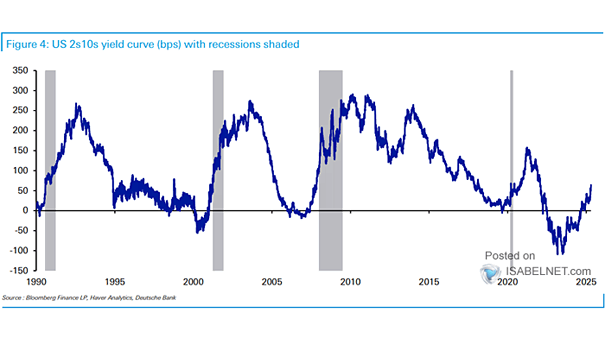
U.S. 10Y-2Y Yield Curve While a steepening inverted yield curve has historically warned of recession, persistent economic strength could mean a more positive outlook for U.S. equities in 2025—though this would mark a notable break from the past. Image: Deutsche Bank
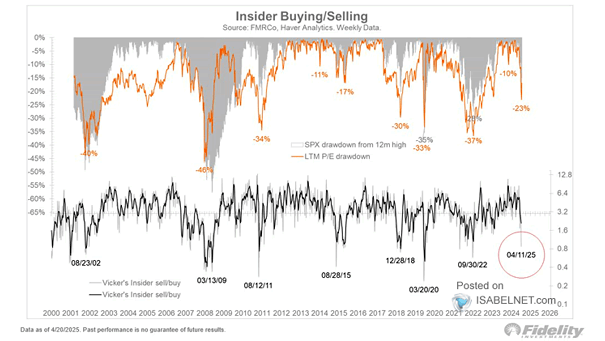
S&P 500 Drawdown and Insider Buying/Selling The Vickers insider sell/buy ratio, which tracks corporate insider transactions, indicates insiders perceive value at current price levels—a trend historically viewed as a bullish signal for market direction. Image: Fidelity Investments
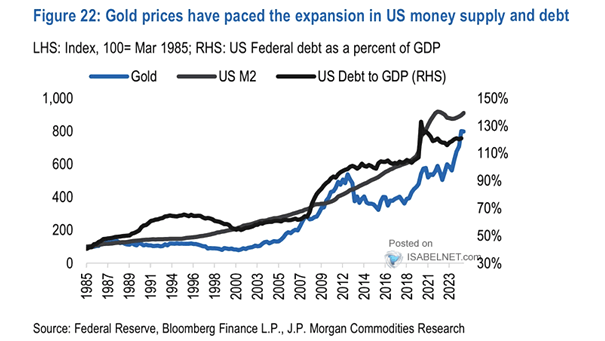
Gold vs. U.S. M2 and U.S. Debt to GDP Historically, gold prices have tracked the expansion of the money supply and have responded to increases in U.S. government debt. Image: J.P. Morgan Commodities Research

ISABELNET Cartoon of the Day Bulls are confident that the bull market in 2025 is as secure as a dog with a bone—stay ready for surprises! Have a Great Day, Everyone! 😎
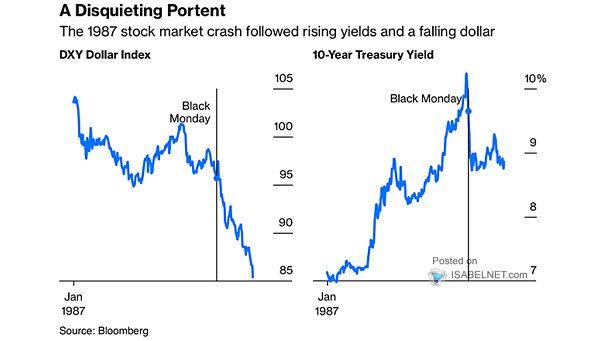
1987 Market Crash – DXY Dollar Index and 10-Year UST Yield Bond yields rarely rise while the dollar falls, as higher yields usually boost currency appeal. This unusual trend signals waning confidence, similar to the pattern seen before the 1987 Black Monday crash. Image: Bloomberg
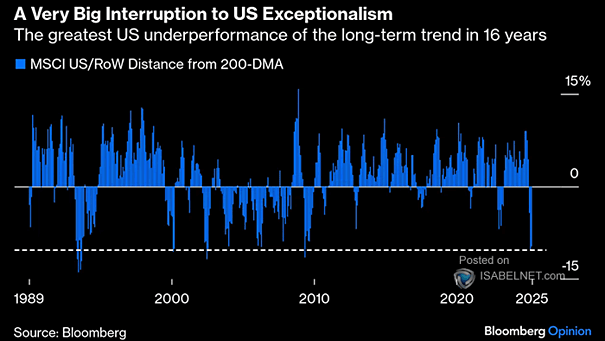
Equities – MSCI U.S./RoW Distance from 200-DMA The MSCI U.S./RoW distance from the 200-DMA highlights a major interruption to the narrative of U.S. exceptionalism and reinforces the need for global diversification in equity portfolios. Image: Bloomberg
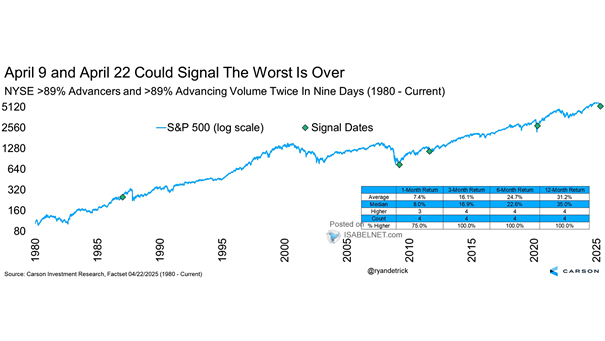
S&P 500 and NYSE >89% Advancers and >89% Advancing Volume in Nine Days A rare event—over 89% of NYSE stocks and volume advancing twice in nine days—has historically signaled strong bullish momentum. Since 1980, the S&P 500 was positive 100% of the time over the next year, with a median 35% gain. Image: Carson Investment…

ISABELNET Cartoon of the Day Wall Street bears are convinced the bull market is crazy, but bulls are too busy wearing noise-canceling headphones to hear any warnings. Happy “Hump” Day, Everyone! 🐫🐪😎
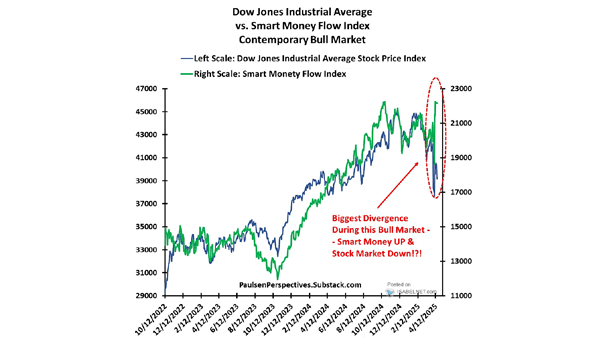
Dow Jones Industrial Average vs. Smart Money Flow Index The Smart Money Flow Index currently suggests that the most probable short-term direction for the U.S. stock market is upward. Image: Paulsen Perspectives