S&P 500 Risk-Adjusted Returns

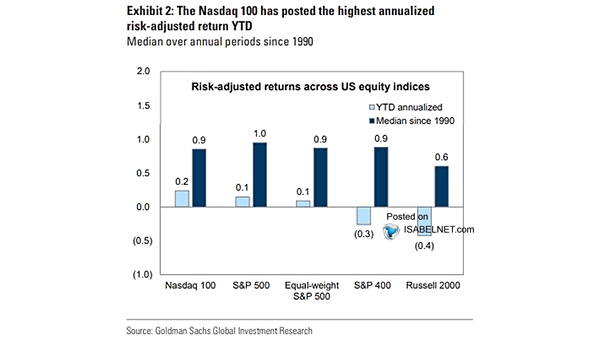
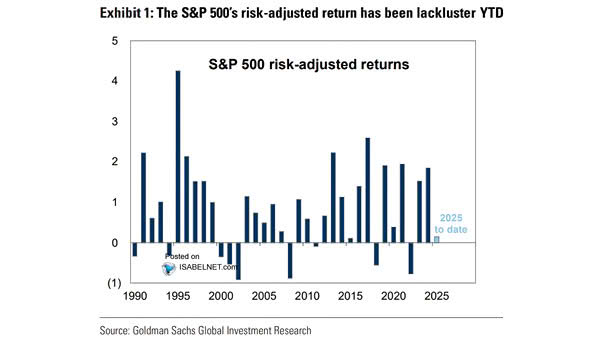
S&P 500 Risk-Adjusted Returns The S&P 500’s risk-adjusted return in 2025 has been disappointing so far, reflecting a challenging market environment characterized by increased volatility and lower-than-average returns. Image: Goldman Sachs Global Investment Research

10-Year U.S. Treasury Yield Fair Value

10-Year U.S. Treasury Yield Fair Value The fair value model for the 10-year U.S. Treasury yield, based on market variables, suggests a fair value close to 3.9%. Image: Deutsche Bank

S&P 500 Performance After Green in Both May and June

S&P 500 Performance After Green in Both May and June Since 1988, when the S&P 500 gains in both May and June—a rare bullish sign—the rest of the year rose 15 of 16 times, averaging 8.8% gains, indicating strong momentum and positive investor sentiment for the year’s second half. Image: Carson Investment Research

Risk-Adjusted Returns Across U.S. Equity Indices

Risk-Adjusted Returns Across U.S. Equity Indices The S&P 500’s performance so far this year has been marked by relatively low returns and high volatility, leading to weak risk-adjusted outcomes and signaling a challenging environment for investors seeking favorable risk-reward balances. Image: Goldman Sachs Global Investment Research

Monthly Flow of G4 Central Bank Asset Purchases

Monthly Flow of G4 Central Bank Asset Purchases Global central banks are continuing to reduce their asset holdings at a robust pace, primarily through balance sheet runoff and measured non-reinvestment of maturing securities. Image: Deutsche Bank

CTAs Allocation in Oil

CTAs Allocation in Oil Given the current market climate, Commodity Trading Advisors have notably raised their exposure to oil. Image: Deutsche Bank Asset Allocation

Brent Crude Oil vs. S&P 500 Index

Brent Crude Oil vs. S&P 500 Index A short-term spike in oil prices may cause market jitters, but only a sustained, significant increase would meaningfully affect U.S. stocks and the broader economy; currently, economic and equity impacts remain limited. Image: Bloomberg

S&P 500 Net Non-Commercial Futures % Open Interest

S&P 500 Net Non-Commercial Futures % Open Interest Large speculators’ bearish positioning in the S&P 500 aligns with historical patterns seen near market lows, supporting the contrarian view that a rally is more likely if shorts are forced to cover. Image: Fundstrat Global Advisors, LLC

3-Month Rolling S&P 500 Retail Flows

3-Month Rolling S&P 500 Retail Flows Retail traders have demonstrated robust buying activity in recent months, with Goldman Sachs estimating net purchases of approximately $20 billion in U.S. stocks over the past three months. Image: Goldman Sachs Global Investment Research

Fed Rate Cuts – Implied by Fed Funds Futures

Fed Cuts – Implied by Fed Funds Futures Fewer Fed rate cuts are expected in 2025, but chances of greater easing in 2026 have risen. This reflects caution amid inflation and policy risks, and leaves room for stronger monetary support if economic conditions worsen. Image: Fundstrat Global Advisors, LLC